Daily Open Gap Zones
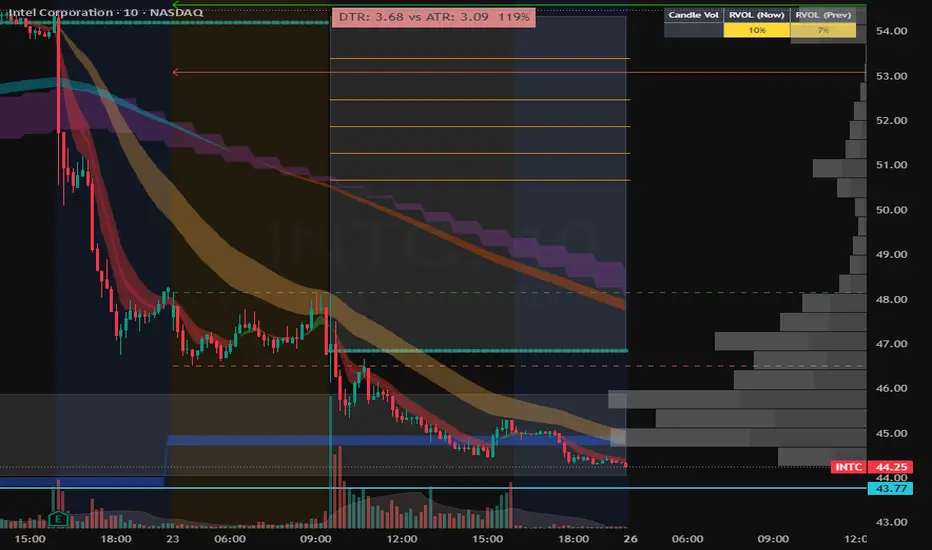
This indicator highlights Daily Opening Gaps by drawing a zone between the previous regular session close and the next regular session open (RTH). Each gap is displayed as a light white filled box with a dotted, transparent white border and is extended forward in time until it is considered filled.
How it works
Gap Definition:
A gap is created when today’s regular-session open is different from yesterday’s regular-session close.
Zone Range:
The gap zone is the price range between those two values.
Unfilled Gaps Only:
The box stays on the chart until the gap is filled, then it is removed.
Fill Mode Options:
Full fill: gap is removed only when price reaches the far edge of the gap zone.
Touch (enter zone): gap is removed as soon as price trades into the gap zone.
Min Gap Size (ticks):
Filters out tiny gaps. A gap is plotted only if
abs(open - prior close) >= minGapTicks × syminfo.mintick.
Best use case
Designed for intraday traders (e.g., 10-minute charts) who want to quickly see open/unfilled daily gaps that may act as support/resistance or mean-reversion targets.

إخلاء المسؤولية
لا يُقصد بالمعلومات والمنشورات أن تكون، أو تشكل، أي نصيحة مالية أو استثمارية أو تجارية أو أنواع أخرى من النصائح أو التوصيات المقدمة أو المعتمدة من TradingView. اقرأ المزيد في شروط الاستخدام.
إخلاء المسؤولية
لا يُقصد بالمعلومات والمنشورات أن تكون، أو تشكل، أي نصيحة مالية أو استثمارية أو تجارية أو أنواع أخرى من النصائح أو التوصيات المقدمة أو المعتمدة من TradingView. اقرأ المزيد في شروط الاستخدام.