OPEN-SOURCE SCRIPT
Delta Flow Volume Profile [UAlgo]
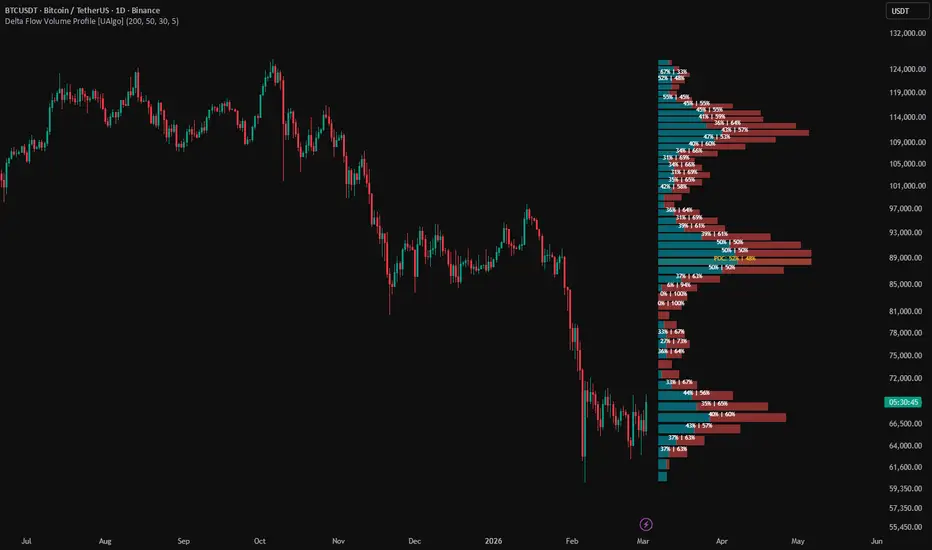
Delta Flow Volume Profile is a price based profile indicator that builds a rolling volume distribution and separates that distribution into bullish and bearish participation at each price zone. Instead of showing only how much total volume traded in an area, the script splits each profile row into buyer dominated and seller dominated segments, then renders those segments side by side on the chart. This creates a more informative profile that helps reveal not only where activity concentrated, but also which side was dominant inside each level.
The indicator runs directly on price (overlay=true) and analyzes a user defined lookback window. It divides the recent price range into fixed bins, distributes each candle’s volume across the bins it overlaps, and classifies that allocated volume as bullish or bearish based on candle direction. The final result is drawn to the right of the chart as a horizontal stacked profile where:
The left segment of each row represents bullish volume
The right segment represents bearish volume
The widest total row identifies the Point of Control (POC)
Each significant row can display buyer and seller percentage labels
This makes the script useful for traders who want a profile style map of participation with directional context, especially when identifying areas where buyers were dominant, sellers were dominant, or both sides were highly active.
Important note: The bullish and bearish split in this script is an approximation based on candle direction (close >= open versus close < open). It is not true bid ask or tick level order flow delta.
🔹 Features
🔸 1) Delta Style Volume Profile by Price Level
The core idea of the script is to turn a standard horizontal volume profile into a directional participation profile. Each row tracks both bullish and bearish volume, so the user can see whether a price zone was primarily buyer controlled, seller controlled, or relatively balanced.
🔸 2) Rolling Lookback Profile
The profile is built from the most recent user selected number of bars. This means the profile continuously adapts to current market structure instead of being locked to a session boundary.
This makes it useful for intraday structure analysis, local range mapping, and recent participation studies.
🔸 3) Fixed Bin Price Segmentation
The script divides the recent highest to lowest range into a configurable number of bins. Lower bin counts create thicker and smoother rows. Higher bin counts create more detailed and granular distribution.
This lets the user control the balance between clarity and resolution.
🔸 4) Proportional Volume Allocation Across Overlapping Bins
When a candle spans multiple bins, the script does not place the full candle volume into a single row. Instead, it allocates volume proportionally according to the overlap between the candle range and each bin.
This produces a more realistic distribution than a single point assignment, especially for larger candles.
🔸 5) Bullish and Bearish Segment Rendering
Each row is drawn as a stacked two part structure:
The bullish segment starts from the left base of the profile
The bearish segment continues immediately after the bullish segment
This gives an intuitive visual read of which side dominated and how much each side contributed inside the same price zone.
🔸 6) Point of Control Highlighting
The script automatically finds the row with the highest total volume and marks it as the Point of Control. The POC row is highlighted with a full width background band, which makes the most active zone immediately obvious.
This is useful for identifying the strongest recent area of price acceptance.
🔸 7) Percentage Labels for Strong Rows
For profile rows with meaningful participation, the script prints a right side label showing:
Bullish percentage
Bearish percentage
For the POC row, the label is prefixed with POC. This gives a quick summary of directional balance at the most important nodes.
🔸 8) Dynamic Label Coloring by Dominance
The percentage labels change color based on row context:
POC labels use the dedicated POC color
Rows dominated by bullish volume use the bullish color
Rows dominated by bearish volume use the bearish color
This improves readability and speeds up visual interpretation.
🔸 9) Adjustable Profile Width and Offset
The profile is drawn to the right of the current bar with configurable:
Profile width as a percentage of lookback
Horizontal offset in bars
This makes it easy to place the profile in a clean position without obstructing live price action.
🔸 10) Smooth Clean Presentation
The script uses borderless boxes and compact right side labels, which gives the profile a clean and uncluttered look. This makes it suitable for traders who want visual structure without excessive chart noise.
🔸 11) Built for Practical Delta Style Context
While it does not use true order flow data, the indicator still provides a highly usable approximation of directional participation. This can help identify:
Buyer heavy zones
Seller heavy zones
Balanced zones
High activity acceptance areas
🔹 Calculations
1) Price Range Detection
The script first determines the highest high and lowest low over the selected lookback:
Pine Script®
This defines the full vertical range of the profile.
2) Bin Construction
That range is divided into the selected number of bins:
Pine Script®
Each bin stores:
Top price
Bottom price
Bullish allocated volume
Bearish allocated volume
The bins are built from top to bottom so the profile rows map naturally across the recent range.
3) Candle by Candle Volume Processing
For every bar in the lookback window, the script reads:
High
Low
Open
Close
Volume
Then it checks each bin to see whether the candle overlaps that bin.
4) Proportional Overlap Allocation
For each overlapping bin, the script calculates:
Pine Script®
If there is overlap, it allocates volume proportionally:
Pine Script®
Interpretation:
If a candle covers multiple price rows, each row receives only the fraction of volume corresponding to its share of the candle’s total range.
This is a more realistic approximation than assigning all volume to one bin.
5) Zero Range Candle Handling
If a candle has zero range, the script assigns the full volume to the bin that contains the candle price:
Pine Script®
This prevents divide by zero issues and still keeps the data usable.
6) Bullish vs Bearish Classification
Once the script calculates allocated volume for a bin, it classifies that volume by candle direction:
Pine Script®
Interpretation:
Bullish volume means the candle closed at or above its open.
Bearish volume means the candle closed below its open.
Important note:
This is a directional approximation. It is not true tape based aggressive buy or aggressive sell volume.
7) Total Volume, Delta, and Percent Methods
Each bin includes helper methods:
totalVol() returns bullVol + bearVol
deltaVol() returns bullVol - bearVol
bullPct() returns bullish percentage of total
bearPct() returns bearish percentage of total
The script actively uses total volume and percentages in rendering. The deltaVol() method is defined for convenience, but this version does not directly plot or label the raw delta value.
8) Point of Control Detection
After all bins are populated, the script finds the row with the largest total volume:
Pine Script®
This row becomes the Point of Control and acts as the strongest recent participation zone.
9) Width Normalization
The total maximum row volume is used as the width normalization anchor. For each row:
Pine Script®
Then the segment widths are scaled into bars:
Pine Script®
Because both bullish and bearish widths are normalized against the same maxVol, their combined width reflects the row’s total participation relative to the profile maximum.
10) Minimum Visible Width Safeguard
If a row has non zero bullish or bearish volume but the calculated width rounds to zero, the script forces a minimum width of one bar:
Pine Script®
This ensures small but meaningful contributions remain visible.
11) Right Side Time Based Layout
The profile is rendered using xloc.bar_time, so all horizontal distances are based on time, not bar index. The script calculates:
A base left time for the profile
A maximum right time
A per bar time width
Key logic:
Pine Script®
This makes the profile appear a fixed number of bar widths to the right of the latest candle.
12) POC Background Highlight
Before drawing the bullish and bearish segments for the POC row, the script paints a full width background band:
Pine Script®
This gives the POC a distinct highlighted backdrop behind the actual stacked volume bars.
13) Visual Gap Inside Each Bin
The script trims the top and bottom of each drawn row slightly:
Pine Script®
This creates small vertical spacing between rows, which improves readability and avoids a fully merged block appearance.
14) Percentage Label Threshold
Labels are not printed for every row. They appear only when the row’s total volume is greater than 15 percent of the maximum row volume:
Pine Script®
This reduces clutter and focuses attention on more relevant nodes.
15) Label Text Construction
For significant rows, the script computes:
Bullish percentage
Bearish percentage
Then formats them as:
Pine Script®
For the POC row:
Pine Script®
The indicator runs directly on price (overlay=true) and analyzes a user defined lookback window. It divides the recent price range into fixed bins, distributes each candle’s volume across the bins it overlaps, and classifies that allocated volume as bullish or bearish based on candle direction. The final result is drawn to the right of the chart as a horizontal stacked profile where:
The left segment of each row represents bullish volume
The right segment represents bearish volume
The widest total row identifies the Point of Control (POC)
Each significant row can display buyer and seller percentage labels
This makes the script useful for traders who want a profile style map of participation with directional context, especially when identifying areas where buyers were dominant, sellers were dominant, or both sides were highly active.
Important note: The bullish and bearish split in this script is an approximation based on candle direction (close >= open versus close < open). It is not true bid ask or tick level order flow delta.
🔹 Features
🔸 1) Delta Style Volume Profile by Price Level
The core idea of the script is to turn a standard horizontal volume profile into a directional participation profile. Each row tracks both bullish and bearish volume, so the user can see whether a price zone was primarily buyer controlled, seller controlled, or relatively balanced.
🔸 2) Rolling Lookback Profile
The profile is built from the most recent user selected number of bars. This means the profile continuously adapts to current market structure instead of being locked to a session boundary.
This makes it useful for intraday structure analysis, local range mapping, and recent participation studies.
🔸 3) Fixed Bin Price Segmentation
The script divides the recent highest to lowest range into a configurable number of bins. Lower bin counts create thicker and smoother rows. Higher bin counts create more detailed and granular distribution.
This lets the user control the balance between clarity and resolution.
🔸 4) Proportional Volume Allocation Across Overlapping Bins
When a candle spans multiple bins, the script does not place the full candle volume into a single row. Instead, it allocates volume proportionally according to the overlap between the candle range and each bin.
This produces a more realistic distribution than a single point assignment, especially for larger candles.
🔸 5) Bullish and Bearish Segment Rendering
Each row is drawn as a stacked two part structure:
The bullish segment starts from the left base of the profile
The bearish segment continues immediately after the bullish segment
This gives an intuitive visual read of which side dominated and how much each side contributed inside the same price zone.
🔸 6) Point of Control Highlighting
The script automatically finds the row with the highest total volume and marks it as the Point of Control. The POC row is highlighted with a full width background band, which makes the most active zone immediately obvious.
This is useful for identifying the strongest recent area of price acceptance.
🔸 7) Percentage Labels for Strong Rows
For profile rows with meaningful participation, the script prints a right side label showing:
Bullish percentage
Bearish percentage
For the POC row, the label is prefixed with POC. This gives a quick summary of directional balance at the most important nodes.
🔸 8) Dynamic Label Coloring by Dominance
The percentage labels change color based on row context:
POC labels use the dedicated POC color
Rows dominated by bullish volume use the bullish color
Rows dominated by bearish volume use the bearish color
This improves readability and speeds up visual interpretation.
🔸 9) Adjustable Profile Width and Offset
The profile is drawn to the right of the current bar with configurable:
Profile width as a percentage of lookback
Horizontal offset in bars
This makes it easy to place the profile in a clean position without obstructing live price action.
🔸 10) Smooth Clean Presentation
The script uses borderless boxes and compact right side labels, which gives the profile a clean and uncluttered look. This makes it suitable for traders who want visual structure without excessive chart noise.
🔸 11) Built for Practical Delta Style Context
While it does not use true order flow data, the indicator still provides a highly usable approximation of directional participation. This can help identify:
Buyer heavy zones
Seller heavy zones
Balanced zones
High activity acceptance areas
🔹 Calculations
1) Price Range Detection
The script first determines the highest high and lowest low over the selected lookback:
This defines the full vertical range of the profile.
2) Bin Construction
That range is divided into the selected number of bins:
Each bin stores:
Top price
Bottom price
Bullish allocated volume
Bearish allocated volume
The bins are built from top to bottom so the profile rows map naturally across the recent range.
3) Candle by Candle Volume Processing
For every bar in the lookback window, the script reads:
High
Low
Open
Close
Volume
Then it checks each bin to see whether the candle overlaps that bin.
4) Proportional Overlap Allocation
For each overlapping bin, the script calculates:
If there is overlap, it allocates volume proportionally:
Interpretation:
If a candle covers multiple price rows, each row receives only the fraction of volume corresponding to its share of the candle’s total range.
This is a more realistic approximation than assigning all volume to one bin.
5) Zero Range Candle Handling
If a candle has zero range, the script assigns the full volume to the bin that contains the candle price:
This prevents divide by zero issues and still keeps the data usable.
6) Bullish vs Bearish Classification
Once the script calculates allocated volume for a bin, it classifies that volume by candle direction:
Interpretation:
Bullish volume means the candle closed at or above its open.
Bearish volume means the candle closed below its open.
Important note:
This is a directional approximation. It is not true tape based aggressive buy or aggressive sell volume.
7) Total Volume, Delta, and Percent Methods
Each bin includes helper methods:
totalVol() returns bullVol + bearVol
deltaVol() returns bullVol - bearVol
bullPct() returns bullish percentage of total
bearPct() returns bearish percentage of total
The script actively uses total volume and percentages in rendering. The deltaVol() method is defined for convenience, but this version does not directly plot or label the raw delta value.
8) Point of Control Detection
After all bins are populated, the script finds the row with the largest total volume:
This row becomes the Point of Control and acts as the strongest recent participation zone.
9) Width Normalization
The total maximum row volume is used as the width normalization anchor. For each row:
Then the segment widths are scaled into bars:
Because both bullish and bearish widths are normalized against the same maxVol, their combined width reflects the row’s total participation relative to the profile maximum.
10) Minimum Visible Width Safeguard
If a row has non zero bullish or bearish volume but the calculated width rounds to zero, the script forces a minimum width of one bar:
This ensures small but meaningful contributions remain visible.
11) Right Side Time Based Layout
The profile is rendered using xloc.bar_time, so all horizontal distances are based on time, not bar index. The script calculates:
A base left time for the profile
A maximum right time
A per bar time width
Key logic:
This makes the profile appear a fixed number of bar widths to the right of the latest candle.
12) POC Background Highlight
Before drawing the bullish and bearish segments for the POC row, the script paints a full width background band:
This gives the POC a distinct highlighted backdrop behind the actual stacked volume bars.
13) Visual Gap Inside Each Bin
The script trims the top and bottom of each drawn row slightly:
This creates small vertical spacing between rows, which improves readability and avoids a fully merged block appearance.
14) Percentage Label Threshold
Labels are not printed for every row. They appear only when the row’s total volume is greater than 15 percent of the maximum row volume:
This reduces clutter and focuses attention on more relevant nodes.
15) Label Text Construction
For significant rows, the script computes:
Bullish percentage
Bearish percentage
Then formats them as:
For the POC row:
نص برمجي مفتوح المصدر
بروح TradingView الحقيقية، قام مبتكر هذا النص البرمجي بجعله مفتوح المصدر، بحيث يمكن للمتداولين مراجعة وظائفه والتحقق منها. شكرا للمؤلف! بينما يمكنك استخدامه مجانًا، تذكر أن إعادة نشر الكود يخضع لقواعد الموقع الخاصة بنا.

Get exclusive indicators: pinescriptmarket.com
All content provided by UAlgo is for informational & educational purposes only. Past performance does not guarantee future results.
All content provided by UAlgo is for informational & educational purposes only. Past performance does not guarantee future results.
إخلاء المسؤولية
لا يُقصد بالمعلومات والمنشورات أن تكون، أو تشكل، أي نصيحة مالية أو استثمارية أو تجارية أو أنواع أخرى من النصائح أو التوصيات المقدمة أو المعتمدة من TradingView. اقرأ المزيد في شروط الاستخدام.
نص برمجي مفتوح المصدر
بروح TradingView الحقيقية، قام مبتكر هذا النص البرمجي بجعله مفتوح المصدر، بحيث يمكن للمتداولين مراجعة وظائفه والتحقق منها. شكرا للمؤلف! بينما يمكنك استخدامه مجانًا، تذكر أن إعادة نشر الكود يخضع لقواعد الموقع الخاصة بنا.
Get exclusive indicators: pinescriptmarket.com
All content provided by UAlgo is for informational & educational purposes only. Past performance does not guarantee future results.
All content provided by UAlgo is for informational & educational purposes only. Past performance does not guarantee future results.
إخلاء المسؤولية
لا يُقصد بالمعلومات والمنشورات أن تكون، أو تشكل، أي نصيحة مالية أو استثمارية أو تجارية أو أنواع أخرى من النصائح أو التوصيات المقدمة أو المعتمدة من TradingView. اقرأ المزيد في شروط الاستخدام.