Adaptive RSI Momentum Engine [AlgoChief]
ABOUT THE INDICATOR
The Relative Strength Index is a core component of technical momentum analysis. However, standard RSI values can remain pinned at extreme levels during strong trending markets and may not fully communicate multi-timeframe momentum conditions.
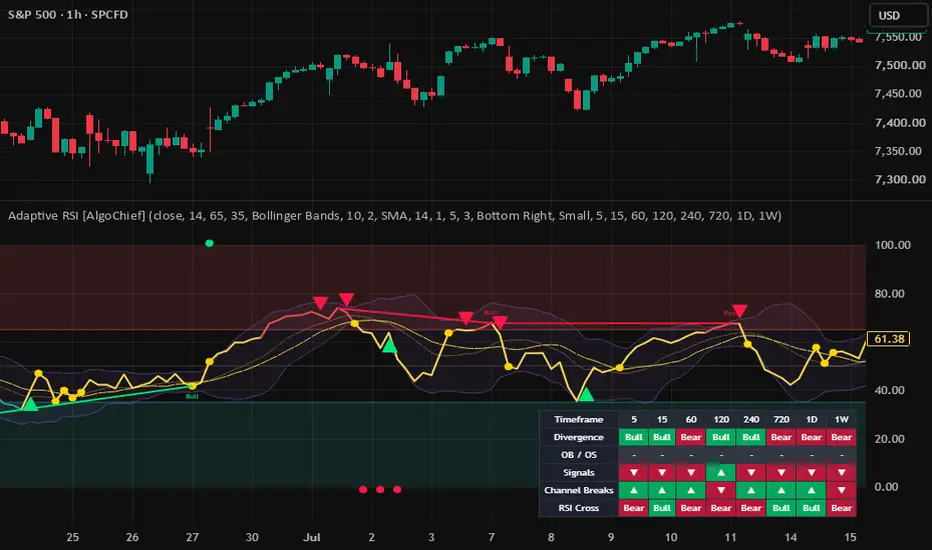
The Adaptive RSI Momentum Engine expands traditional oscillator analysis into a multi-layered momentum framework designed to identify potential market exhaustion, trend continuation, and momentum turning points.
By combining volatility-adaptive channels, regular and hidden divergence detection, post-signal deviation levels, and an integrated multi-timeframe dashboard, the indicator provides a broader structural view of momentum.
Traders can evaluate whether momentum is expanding or weakening in relation to current volatility conditions and higher-timeframe market trends.
HOW IT WORKS
The indicator operates through several coordinated analytical layers.
1. RSI Momentum Calculation
The core Relative Strength Index is calculated using a user-defined lookback period and price source.
An optional smoothing moving average can be applied to the RSI using SMA, EMA, SMMA/RMA, WMA, or VWMA. This helps reduce market noise and provides a smoother view of the underlying momentum direction.
2. Dynamic Volatility Channels
Dynamic volatility channels can be applied directly to the RSI curve, including Bollinger Bands, Keltner Channels, and Donchian Channels.
These channels allow traders to evaluate momentum expansion relative to current market conditions. When RSI moves beyond the channel boundaries, it can highlight momentum extremes or periods of increased volatility.
3. Divergence Detection
The automated divergence engine analyzes the relationship between price swing points and RSI swing points.
Regular divergences are used to identify potential momentum exhaustion and reversal conditions, while hidden divergences are used to identify potential trend continuation during corrective pullbacks.
4. Deviation Levels
Following confirmed reversal or divergence signals, the indicator can project +1 and +2 standard deviation milestone levels.
These levels provide objective reference points for evaluating whether momentum continues to develop after the initial signal.
5. Multi-Timeframe Dashboard
The integrated multi-timeframe dashboard can monitor divergence conditions, overbought and oversold states, reversal triggers, channel breakouts, and moving-average crosses across up to eight configurable timeframes.
Interactive tooltips also display the number of bars elapsed since a signal was triggered, with signals automatically expiring after 50 bars.
SIGNALS
The indicator provides several visual signals for evaluating changes in momentum and market conditions.
Momentum Reversal Signals
Green upward triangles indicate bullish reversal conditions, while red downward triangles indicate bearish reversal conditions.
A bullish reversal is triggered when RSI pivots upward from an oversold condition or from below the lower dynamic channel.
A bearish reversal is triggered when RSI pivots downward from an overbought condition or from above the upper dynamic channel.
Regular Bullish and Bearish Divergences
Regular bullish divergence occurs when price forms lower swing lows while RSI forms higher lows, indicating weakening downward momentum.
Regular bearish divergence occurs when price forms higher swing highs while RSI forms lower highs, indicating weakening upward momentum.
Hidden Continuation Divergences
Hidden bullish divergence occurs when price forms higher lows while RSI forms lower lows during an established uptrend.
Hidden bearish divergence occurs when price forms lower highs while RSI forms higher highs during an established downtrend.
These patterns are designed to highlight potential continuation conditions following corrective movements.
Smoothing MA Crossovers
Yellow circular markers indicate momentum shifts when the RSI crosses above or below its selected smoothing moving average.
Volatility Channel Breakouts
Circular breakout markers identify instances where RSI moves beyond the upper or lower volatility channel, highlighting potential momentum expansion.
Deviation Level Crossings
Deviation signals occur when RSI crosses the projected +1 or +2 standard deviation levels following an initial reversal or divergence signal.
These signals represent statistical changes in momentum and volatility and should not be interpreted as guaranteed reversal or continuation signals.
KEY FEATURES
• Dynamic volatility channel models including Bollinger Bands, Keltner Channels, and Donchian Channels applied directly to RSI.
• Regular and hidden divergence detection for potential reversal and continuation conditions.
• Forward-projected +1 and +2 standard deviation levels for monitoring post-signal momentum.
• Multi-timeframe dashboard supporting up to eight configurable timeframes.
• Interactive bar-age information showing how recently a signal occurred.
• Visual overbought and oversold exhaustion zones.
• Multiple RSI smoothing methods including SMA, EMA, SMMA/RMA, WMA, and VWMA.
• Comprehensive alerts covering divergences, reversals, channel breakouts, moving-average crosses, and deviation levels.
SETTINGS EXPLANATION
RSI Configuration
Price Source
Selects the price series used for RSI calculation. The default source is Close.
RSI Period
Defines the lookback period used for the core Relative Strength Index calculation.
Exhaustion Horizons
Overbought Horizon
Defines the upper threshold for overbought conditions and exhaustion-zone rendering. Default: 65.
Oversold Horizon
Defines the lower threshold for oversold conditions and exhaustion-zone rendering. Default: 35.
Dynamic Volatility Channels
Channel Model
Selects the volatility channel applied to RSI. Available options include None, Bollinger Bands, Keltner Channel, and Donchian Channel.
Channel Period
Controls the lookback period used for volatility calculations.
Band Multiplier
Adjusts the width of the channel bands by changing the standard deviation or range multiplier.
RSI Smoothing
Smoothing Type
Selects the moving-average method applied to RSI. Available options include None, SMA, EMA, SMMA/RMA, WMA, and VWMA.
Smoothing Period
Defines the lookback period used by the selected smoothing moving average.
Momentum Reversals
Show Momentum Reversal Triggers
Controls the visibility of bullish and bearish reversal markers on the oscillator.
Plot Reversal Deviation Levels (+1/+2)
Enables or disables forward-projected deviation levels following reversal signals.
Reversal Deviation Multiplier
Controls the spacing of the projected reversal deviation levels.
Divergence Engine
Enable Divergence Detection
Activates the pivot-based divergence detection system.
Pivot Lookback
Defines the number of confirmation bars used on the left and right side of swing pivots.
Detect Hidden Continuation Divergence
Enables detection of hidden bullish and bearish continuation divergence.
Plot Divergence Deviation Levels (+1/+2)
Enables or disables projected deviation levels following confirmed divergence signals.
Divergence Deviation Multiplier
Controls the deviation factor used for divergence follow-through projections.
Multi-Timeframe Dashboard
Show Multi-Timeframe Dashboard
Controls the visibility of the multi-timeframe dashboard.
Dashboard Position
Controls the dashboard position within the chart pane.
Available positions include Top Right, Bottom Right, Top Left, and Bottom Left.
Dashboard Size
Controls the dashboard scale with Tiny, Small, Normal, and Large options.
Dashboard Timeframes
Slots 1 through 8 allow individual timeframe selection and enable complete customization of the monitored intervals.
HOW TO USE
For more effective analysis, the indicator should be interpreted together with broader market structure and price action.
1. Identify Exhaustion at Key Structural Levels
When price approaches major support or resistance while RSI enters an overbought or oversold zone, monitor for reversal signals or regular divergences as potential confirmation of momentum exhaustion.
2. Confirm Trend Continuation
During established trends, use hidden divergences and volatility channel breakouts in the direction of the dominant trend to identify potential continuation conditions following corrective pullbacks.
3. Check Multi-Timeframe Alignment
Use the dashboard to determine whether multiple timeframes are showing aligned conditions.
Signals supported across several timeframes can provide stronger analytical context than an isolated signal from a single timeframe.
4. Evaluate Post-Signal Momentum
After a reversal or divergence signal, monitor whether RSI reaches and holds beyond the +1 and +2 deviation levels.
This can help evaluate whether sufficient momentum follow-through is developing before managing trade risk.
Always combine momentum analysis with market structure, appropriate position sizing, and disciplined risk management.
ALERTS
The indicator includes dedicated alert conditions that can be connected to TradingView notifications.
• Bullish Divergence / Bearish Divergence
Triggers when a regular bullish or bearish divergence pattern is confirmed.
• Hidden Bullish Divergence / Hidden Bearish Divergence
Triggers when a hidden continuation divergence is confirmed.
• Bullish Reversal / Bearish Reversal
Triggers when an RSI momentum reversal condition is confirmed.
• Channel Break Up / Channel Break Down
Triggers when RSI moves outside the selected dynamic volatility channel.
• RSI Smoothing Bullish Cross / Bearish Cross
Triggers when RSI crosses above or below its selected smoothing moving average.
• Reversal Deviation +1 / +2 Cross
Triggers when RSI crosses the projected reversal deviation levels.
• Divergence Deviation +1 / +2 Cross
Triggers when RSI crosses the projected divergence deviation levels.
IMPORTANT NOTES
Pivot Confirmation
Divergence patterns and swing pivots require completed right-side confirmation bars. As a result, divergence signals and labels are confirmed only after the required lookback bars have closed.
Real-Time Bar Dynamics
Unclosed real-time candles can change as new price data arrives. For more reliable signal evaluation, wait for candle-close confirmation.
Multi-Timeframe Sampling
The dashboard uses closed historical data while continuously updating developing higher-timeframe values in real time.
Strong Trending Markets
During strong and persistent trends, RSI can remain in overbought or oversold territory for extended periods.
Counter-trend divergence signals should therefore not be used in isolation. Always consider the broader price structure and market conditions.
DISCLAIMER
This indicator is published strictly for analytical, research, and educational purposes. It does not constitute financial, investment, or trading advice.
Past technical behavior, signals, and pattern recognition do not guarantee future market outcomes.
Financial trading involves significant risk of capital loss. Users are solely responsible for their own trading decisions, position sizing, and risk-management parameters.
The Relative Strength Index is a core component of technical momentum analysis. However, standard RSI values can remain pinned at extreme levels during strong trending markets and may not fully communicate multi-timeframe momentum conditions.
The Adaptive RSI Momentum Engine expands traditional oscillator analysis into a multi-layered momentum framework designed to identify potential market exhaustion, trend continuation, and momentum turning points.
By combining volatility-adaptive channels, regular and hidden divergence detection, post-signal deviation levels, and an integrated multi-timeframe dashboard, the indicator provides a broader structural view of momentum.
Traders can evaluate whether momentum is expanding or weakening in relation to current volatility conditions and higher-timeframe market trends.
HOW IT WORKS
The indicator operates through several coordinated analytical layers.
1. RSI Momentum Calculation
The core Relative Strength Index is calculated using a user-defined lookback period and price source.
An optional smoothing moving average can be applied to the RSI using SMA, EMA, SMMA/RMA, WMA, or VWMA. This helps reduce market noise and provides a smoother view of the underlying momentum direction.
2. Dynamic Volatility Channels
Dynamic volatility channels can be applied directly to the RSI curve, including Bollinger Bands, Keltner Channels, and Donchian Channels.
These channels allow traders to evaluate momentum expansion relative to current market conditions. When RSI moves beyond the channel boundaries, it can highlight momentum extremes or periods of increased volatility.
3. Divergence Detection
The automated divergence engine analyzes the relationship between price swing points and RSI swing points.
Regular divergences are used to identify potential momentum exhaustion and reversal conditions, while hidden divergences are used to identify potential trend continuation during corrective pullbacks.
4. Deviation Levels
Following confirmed reversal or divergence signals, the indicator can project +1 and +2 standard deviation milestone levels.
These levels provide objective reference points for evaluating whether momentum continues to develop after the initial signal.
5. Multi-Timeframe Dashboard
The integrated multi-timeframe dashboard can monitor divergence conditions, overbought and oversold states, reversal triggers, channel breakouts, and moving-average crosses across up to eight configurable timeframes.
Interactive tooltips also display the number of bars elapsed since a signal was triggered, with signals automatically expiring after 50 bars.
SIGNALS
The indicator provides several visual signals for evaluating changes in momentum and market conditions.
Momentum Reversal Signals
Green upward triangles indicate bullish reversal conditions, while red downward triangles indicate bearish reversal conditions.
A bullish reversal is triggered when RSI pivots upward from an oversold condition or from below the lower dynamic channel.
A bearish reversal is triggered when RSI pivots downward from an overbought condition or from above the upper dynamic channel.
Regular Bullish and Bearish Divergences
Regular bullish divergence occurs when price forms lower swing lows while RSI forms higher lows, indicating weakening downward momentum.
Regular bearish divergence occurs when price forms higher swing highs while RSI forms lower highs, indicating weakening upward momentum.
Hidden Continuation Divergences
Hidden bullish divergence occurs when price forms higher lows while RSI forms lower lows during an established uptrend.
Hidden bearish divergence occurs when price forms lower highs while RSI forms higher highs during an established downtrend.
These patterns are designed to highlight potential continuation conditions following corrective movements.
Smoothing MA Crossovers
Yellow circular markers indicate momentum shifts when the RSI crosses above or below its selected smoothing moving average.
Volatility Channel Breakouts
Circular breakout markers identify instances where RSI moves beyond the upper or lower volatility channel, highlighting potential momentum expansion.
Deviation Level Crossings
Deviation signals occur when RSI crosses the projected +1 or +2 standard deviation levels following an initial reversal or divergence signal.
These signals represent statistical changes in momentum and volatility and should not be interpreted as guaranteed reversal or continuation signals.
KEY FEATURES
• Dynamic volatility channel models including Bollinger Bands, Keltner Channels, and Donchian Channels applied directly to RSI.
• Regular and hidden divergence detection for potential reversal and continuation conditions.
• Forward-projected +1 and +2 standard deviation levels for monitoring post-signal momentum.
• Multi-timeframe dashboard supporting up to eight configurable timeframes.
• Interactive bar-age information showing how recently a signal occurred.
• Visual overbought and oversold exhaustion zones.
• Multiple RSI smoothing methods including SMA, EMA, SMMA/RMA, WMA, and VWMA.
• Comprehensive alerts covering divergences, reversals, channel breakouts, moving-average crosses, and deviation levels.
SETTINGS EXPLANATION
RSI Configuration
Price Source
Selects the price series used for RSI calculation. The default source is Close.
RSI Period
Defines the lookback period used for the core Relative Strength Index calculation.
Exhaustion Horizons
Overbought Horizon
Defines the upper threshold for overbought conditions and exhaustion-zone rendering. Default: 65.
Oversold Horizon
Defines the lower threshold for oversold conditions and exhaustion-zone rendering. Default: 35.
Dynamic Volatility Channels
Channel Model
Selects the volatility channel applied to RSI. Available options include None, Bollinger Bands, Keltner Channel, and Donchian Channel.
Channel Period
Controls the lookback period used for volatility calculations.
Band Multiplier
Adjusts the width of the channel bands by changing the standard deviation or range multiplier.
RSI Smoothing
Smoothing Type
Selects the moving-average method applied to RSI. Available options include None, SMA, EMA, SMMA/RMA, WMA, and VWMA.
Smoothing Period
Defines the lookback period used by the selected smoothing moving average.
Momentum Reversals
Show Momentum Reversal Triggers
Controls the visibility of bullish and bearish reversal markers on the oscillator.
Plot Reversal Deviation Levels (+1/+2)
Enables or disables forward-projected deviation levels following reversal signals.
Reversal Deviation Multiplier
Controls the spacing of the projected reversal deviation levels.
Divergence Engine
Enable Divergence Detection
Activates the pivot-based divergence detection system.
Pivot Lookback
Defines the number of confirmation bars used on the left and right side of swing pivots.
Detect Hidden Continuation Divergence
Enables detection of hidden bullish and bearish continuation divergence.
Plot Divergence Deviation Levels (+1/+2)
Enables or disables projected deviation levels following confirmed divergence signals.
Divergence Deviation Multiplier
Controls the deviation factor used for divergence follow-through projections.
Multi-Timeframe Dashboard
Show Multi-Timeframe Dashboard
Controls the visibility of the multi-timeframe dashboard.
Dashboard Position
Controls the dashboard position within the chart pane.
Available positions include Top Right, Bottom Right, Top Left, and Bottom Left.
Dashboard Size
Controls the dashboard scale with Tiny, Small, Normal, and Large options.
Dashboard Timeframes
Slots 1 through 8 allow individual timeframe selection and enable complete customization of the monitored intervals.
HOW TO USE
For more effective analysis, the indicator should be interpreted together with broader market structure and price action.
1. Identify Exhaustion at Key Structural Levels
When price approaches major support or resistance while RSI enters an overbought or oversold zone, monitor for reversal signals or regular divergences as potential confirmation of momentum exhaustion.
2. Confirm Trend Continuation
During established trends, use hidden divergences and volatility channel breakouts in the direction of the dominant trend to identify potential continuation conditions following corrective pullbacks.
3. Check Multi-Timeframe Alignment
Use the dashboard to determine whether multiple timeframes are showing aligned conditions.
Signals supported across several timeframes can provide stronger analytical context than an isolated signal from a single timeframe.
4. Evaluate Post-Signal Momentum
After a reversal or divergence signal, monitor whether RSI reaches and holds beyond the +1 and +2 deviation levels.
This can help evaluate whether sufficient momentum follow-through is developing before managing trade risk.
Always combine momentum analysis with market structure, appropriate position sizing, and disciplined risk management.
ALERTS
The indicator includes dedicated alert conditions that can be connected to TradingView notifications.
• Bullish Divergence / Bearish Divergence
Triggers when a regular bullish or bearish divergence pattern is confirmed.
• Hidden Bullish Divergence / Hidden Bearish Divergence
Triggers when a hidden continuation divergence is confirmed.
• Bullish Reversal / Bearish Reversal
Triggers when an RSI momentum reversal condition is confirmed.
• Channel Break Up / Channel Break Down
Triggers when RSI moves outside the selected dynamic volatility channel.
• RSI Smoothing Bullish Cross / Bearish Cross
Triggers when RSI crosses above or below its selected smoothing moving average.
• Reversal Deviation +1 / +2 Cross
Triggers when RSI crosses the projected reversal deviation levels.
• Divergence Deviation +1 / +2 Cross
Triggers when RSI crosses the projected divergence deviation levels.
IMPORTANT NOTES
Pivot Confirmation
Divergence patterns and swing pivots require completed right-side confirmation bars. As a result, divergence signals and labels are confirmed only after the required lookback bars have closed.
Real-Time Bar Dynamics
Unclosed real-time candles can change as new price data arrives. For more reliable signal evaluation, wait for candle-close confirmation.
Multi-Timeframe Sampling
The dashboard uses closed historical data while continuously updating developing higher-timeframe values in real time.
Strong Trending Markets
During strong and persistent trends, RSI can remain in overbought or oversold territory for extended periods.
Counter-trend divergence signals should therefore not be used in isolation. Always consider the broader price structure and market conditions.
DISCLAIMER
This indicator is published strictly for analytical, research, and educational purposes. It does not constitute financial, investment, or trading advice.
Past technical behavior, signals, and pattern recognition do not guarantee future market outcomes.
Financial trading involves significant risk of capital loss. Users are solely responsible for their own trading decisions, position sizing, and risk-management parameters.

For access & queries: algochiefsupport@gmail.com
إخلاء المسؤولية
لا يُقصد بالمعلومات والمنشورات أن تكون، أو تشكل، أي نصيحة مالية أو استثمارية أو تجارية أو أنواع أخرى من النصائح أو التوصيات المقدمة أو المعتمدة من TradingView. اقرأ المزيد في شروط الاستخدام.
For access & queries: algochiefsupport@gmail.com
إخلاء المسؤولية
لا يُقصد بالمعلومات والمنشورات أن تكون، أو تشكل، أي نصيحة مالية أو استثمارية أو تجارية أو أنواع أخرى من النصائح أو التوصيات المقدمة أو المعتمدة من TradingView. اقرأ المزيد في شروط الاستخدام.