OPEN-SOURCE SCRIPT
Shift Share - 5 Model Diagnostics 050826
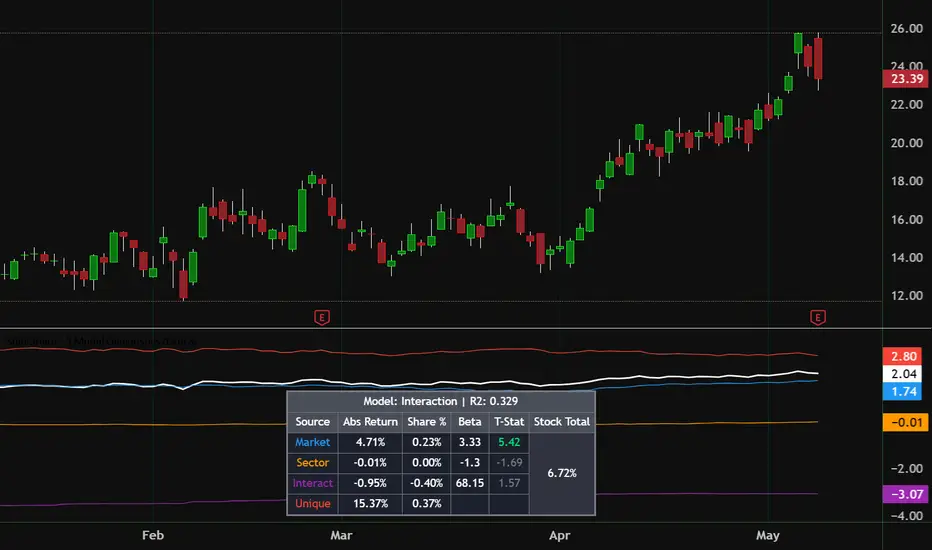
Shift Share - 5 Model Diagnostics 050826
(updated version of **Shift Share - Full Diagnostics & R2 Public** indicator
User Guide: Shift-Share 5 Model Diagnostics 050826
This indicator is a sophisticated regression-based tool designed to "clean" a stock's price action. It separates the raw return of a ticker into specific drivers: the Market, the Sector, their Interaction, and the stock’s own Unique (Idiosyncratic) strength.
The indicator plots cumulative returns broken down by source. Instead of just seeing "the stock is up 5%," this tool tells you:
Model Selection (model_type)
This determines how the math decomposes the returns.
** Interaction (Default): The most complex model. It looks for Market, Sector, and the "Interaction" effect between them.
** Simple Linear: Looks at Market and Sector individually without the interaction variable.
** Market Only / Sector Only: Strips away everything except the chosen benchmark. Use this to see how much a stock is "tethered" to just one factor.
** No Variable: Shows only the raw stock return vs. its residual.
Benchmarks & Logic
The table at the bottom of your chart provides the statistical "health check" of the stock.
R2 (R-Squared)
How much of the stock's move is explained by the Market/Sector. High R2 means the stock is a "slave" to the index. Low R2 means the stock moves on its own news.
Share %
The percentage of the total move attributed to that specific source.
Beta
The sensitivity. A Market Beta of 1.5 means for every 1% the market moves, this stock tends to move 1.5%.
T-Stat
CRITICAL: If the T-Stat is > 2.0 (highlights Green), the relationship is "Statistically Significant." If it’s low, the connection might just be random noise.
Note on Orthogonalization: This script uses "orthogonalized" returns. This means it mathematically strips the "Market influence" out of the "Sector return" before calculating. This prevents "double counting" and ensures the Sector Shift is truly about the industry, not just the market rising.
(updated version of **Shift Share - Full Diagnostics & R2 Public** indicator
User Guide: Shift-Share 5 Model Diagnostics 050826
This indicator is a sophisticated regression-based tool designed to "clean" a stock's price action. It separates the raw return of a ticker into specific drivers: the Market, the Sector, their Interaction, and the stock’s own Unique (Idiosyncratic) strength.
- Key Concept: What are you looking at?
The indicator plots cumulative returns broken down by source. Instead of just seeing "the stock is up 5%," this tool tells you:
- The stock is up 5%, but 4% of that was just the S&P 500 rising, and only 1% was the company actually doing well.
- Market (Blue): Return driven by the broad index (e.g., SPY).
- Sector (Orange): Return driven by the specific industry (e.g., XLF), adjusted to remove market overlap.
- Interaction (Purple): Return generated by the synergy between the market and sector.
- Unique (Red): The "Alpha." This is the movement left over that belongs only to the stock.
- Stock Total (White): The actual cumulative return of the ticker.
- Input Parameters
Model Selection (model_type)
This determines how the math decomposes the returns.
** Interaction (Default): The most complex model. It looks for Market, Sector, and the "Interaction" effect between them.
** Simple Linear: Looks at Market and Sector individually without the interaction variable.
** Market Only / Sector Only: Strips away everything except the chosen benchmark. Use this to see how much a stock is "tethered" to just one factor.
** No Variable: Shows only the raw stock return vs. its residual.
Benchmarks & Logic
- Sector ETF / Market Index: Enter the tickers you want to compare against (e.g., QQQ for tech, SPY for market).
- Rolling Window: The number of bars (default 60) used to calculate the correlation (Beta). A shorter window reacts faster; a longer window is more stable.
- Reading the Diagnostic Table
The table at the bottom of your chart provides the statistical "health check" of the stock.
R2 (R-Squared)
How much of the stock's move is explained by the Market/Sector. High R2 means the stock is a "slave" to the index. Low R2 means the stock moves on its own news.
Share %
The percentage of the total move attributed to that specific source.
Beta
The sensitivity. A Market Beta of 1.5 means for every 1% the market moves, this stock tends to move 1.5%.
T-Stat
CRITICAL: If the T-Stat is > 2.0 (highlights Green), the relationship is "Statistically Significant." If it’s low, the connection might just be random noise.
- Strategic Interpretation
- *The "Pure Play" Signal: If the Unique (Red) line is trending higher while the Total (White) line is flat, the stock is showing hidden internal strength even if the price isn't moving yet.]
- The "Hollow" Rally: If the White line is rising but the Red line is falling, the stock is "weak" and is only being dragged up by a strong market. This is a high-risk long position.
- The Alpha Hunt: Professional traders look for stocks where the Unique component is the largest contributor to the total return, indicating a company with a specific catalyst independent of the macro economy.
Note on Orthogonalization: This script uses "orthogonalized" returns. This means it mathematically strips the "Market influence" out of the "Sector return" before calculating. This prevents "double counting" and ensures the Sector Shift is truly about the industry, not just the market rising.
نص برمجي مفتوح المصدر
بروح TradingView الحقيقية، قام مبتكر هذا النص البرمجي بجعله مفتوح المصدر، بحيث يمكن للمتداولين مراجعة وظائفه والتحقق منها. شكرا للمؤلف! بينما يمكنك استخدامه مجانًا، تذكر أن إعادة نشر الكود يخضع لقواعد الموقع الخاصة بنا.

إخلاء المسؤولية
لا يُقصد بالمعلومات والمنشورات أن تكون، أو تشكل، أي نصيحة مالية أو استثمارية أو تجارية أو أنواع أخرى من النصائح أو التوصيات المقدمة أو المعتمدة من TradingView. اقرأ المزيد في شروط الاستخدام.
نص برمجي مفتوح المصدر
بروح TradingView الحقيقية، قام مبتكر هذا النص البرمجي بجعله مفتوح المصدر، بحيث يمكن للمتداولين مراجعة وظائفه والتحقق منها. شكرا للمؤلف! بينما يمكنك استخدامه مجانًا، تذكر أن إعادة نشر الكود يخضع لقواعد الموقع الخاصة بنا.
إخلاء المسؤولية
لا يُقصد بالمعلومات والمنشورات أن تكون، أو تشكل، أي نصيحة مالية أو استثمارية أو تجارية أو أنواع أخرى من النصائح أو التوصيات المقدمة أو المعتمدة من TradingView. اقرأ المزيد في شروط الاستخدام.