OPEN-SOURCE SCRIPT
تم تحديثه Hidden Divergence Continuation Zones [AGPro Series]
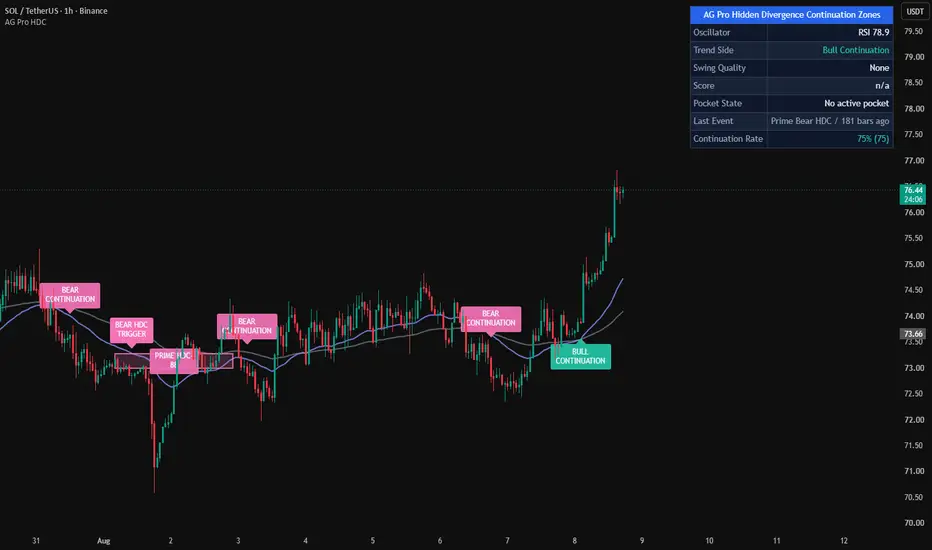
Hidden Divergence Continuation Zones [AGPro Series]
🟦 Overview
Hidden Divergence Continuation Zones [AGPro Series] is a focused trend-continuation indicator built around one specific market behavior: hidden divergence that forms during a structured pullback inside an existing directional move.
Most divergence tools are built to search for reversals. They scan regular bullish and bearish divergence, print many labels, and often mix every oscillator event into the same visual map. This script intentionally takes a narrower lane. It does not try to be a general divergence scanner. It looks only for hidden bullish and hidden bearish divergence, because hidden divergence is most useful when the question is not "is the trend ending?" but "is the trend trying to continue after a controlled pullback?"
The result is a cleaner continuation framework:
- confirmed price swing structure
- RSI momentum displacement
- EMA and DMI trend filtering
- ATR-normalized quality scoring
- lower-intensity HDC Watch labels
- forward continuation pockets
- swing connectors
- trigger labels
- compact AGPro dashboard
The purpose is to make hidden continuation structure visible without filling the chart with every possible divergence mark.
🔹 What Makes This Different
This script is separated from both common public divergence tools and our existing AGPro divergence family by design.
It is not a multi-oscillator regular divergence stack. It does not score RSI, MACD, CCI, MFI, and OBV together. That lane is already covered by broader stack-style divergence tools.
It is not an OBV pressure divergence map. It does not study price-versus-participation disagreement through cumulative volume pressure.
It is not a trend dashboard with divergence added as a side feature.
Hidden Divergence Continuation Zones focuses on a single continuation workflow:
1. Confirm that the market has an active directional side.
2. Wait for a valid pullback swing.
3. Compare the new swing against the previous swing.
4. Accept only hidden divergence that supports continuation.
5. Draw a forward pocket from the continuation pivot.
6. Track whether price later triggers from that structure.
That narrow scope is the edge. The script is designed to avoid visual noise and avoid conceptual overlap.
🧭 Core Logic
Bullish hidden continuation:
- the trend filter must support a bullish continuation environment
- price must form a confirmed higher low
- RSI must form a lower low against that higher price low
- the two compared swings must be separated by enough bars
- the structure must be large enough relative to ATR
- the RSI displacement must clear the minimum threshold
- the final continuation score must pass the display threshold
Bearish hidden continuation:
- the trend filter must support a bearish continuation environment
- price must form a confirmed lower high
- RSI must form a higher high against that lower price high
- the two compared swings must be separated by enough bars
- the structure must be large enough relative to ATR
- the RSI displacement must clear the minimum threshold
- the final continuation score must pass the display threshold
The script uses confirmed pivots, so events appear only after the pivot is structurally available. This keeps the logic stable and prevents premature labels from appearing on incomplete swings.
📐 Continuation Score
Each qualified setup is graded with a 0 to 100 continuation score.
The score combines:
- ADX strength above the selected minimum
- ATR-normalized distance between the compared swings
- RSI displacement between the two pivot points
- whether the pullback sits in a continuation-relevant EMA area
- whether the fast and slow EMA structure remains aligned
The default thresholds are designed to keep the chart selective. Normal qualified events are shown as HDC+ or HDC-. Stronger events are shown as PRIME HDC+ or PRIME HDC-.
Lower-intensity confirmed hidden divergence candidates can also be displayed as HDC WATCH labels. These marks are intentionally softer: they add visual context and keep the chart informative, but they do not create continuation pockets or trigger tracking unless the full continuation threshold is reached.
🧩 Continuation Pockets
When a hidden continuation event qualifies, the script projects a forward pocket from the pivot area.
These pockets are not generic support and resistance boxes. They are continuation context zones tied directly to the hidden divergence pivot. Their job is to preserve the important pullback area on the chart after the label appears, so the user can see where the continuation structure was created.
Pocket height is ATR-based, which helps the zones adapt across symbols and timeframes. The number of visible pockets is capped, so older structures are automatically removed and the chart remains clean.
🎯 Trigger Labels
After a hidden divergence pocket is created, the script monitors a limited trigger window.
For bullish continuation, a trigger is printed only when price confirms above the pivot candle reference with the selected ATR buffer.
For bearish continuation, a trigger is printed only when price confirms below the pivot candle reference with the selected ATR buffer.
This keeps the workflow organized:
- hidden divergence creates the continuation pocket
- the pocket defines the structure
- the trigger label marks follow-through from that structure
⚙️ Dashboard
The AGPro panel is built for quick reading:
- Oscillator: current RSI value
- Trend Side: bullish continuation, bearish continuation, or neutral
- Swing Quality: none, building, qualified, or prime
- Continuation Score: latest event score
- Active Pocket: current pocket state and freshness
The first panel row follows the AGPro standard: one merged blue header row with only the script title. Panel location, panel theme, label font size, and panel font size are all adjustable from settings.
🧪 Practical Reading
A clean bullish continuation sequence usually looks like this:
1. Trend Side shows Bull Continuation.
2. Price pulls back and forms a confirmed higher low.
3. RSI makes a lower low at that swing.
4. A continuation pocket appears below/around the pullback area.
5. A trigger label appears only if price follows through during the trigger window.
A clean bearish continuation sequence usually looks like this:
1. Trend Side shows Bear Continuation.
2. Price pulls back and forms a confirmed lower high.
3. RSI makes a higher high at that swing.
4. A continuation pocket appears above/around the pullback area.
5. A trigger label appears only if price follows through during the trigger window.
The best use case is structured trend continuation study, especially when a trader wants to separate controlled pullbacks from random oscillator divergence noise.
🔍 Key Inputs
Trend Continuation Filter:
- Fast EMA Length
- Slow EMA Length
- EMA Slope Lookback
- DMI Length
- ADX Smoothing
- Minimum ADX
Hidden Divergence Engine:
- RSI Length
- Confirmed Pivot Length
- Minimum Pivot Separation
- Minimum Price Swing (ATR)
- Minimum RSI Displacement
- Minimum Continuation Score
- Prime Score Threshold
- Show HDC Watch Labels
- Watch Label Score
Continuation Pockets:
- Show Continuation Pockets
- Pocket Extension Bars
- Pocket Height (ATR)
- Maximum Visible Pockets
- Trigger Window Bars
- Trigger Buffer (ATR)
Visual Layout:
- EMA Backbone
- Swing Connectors
- Event Labels
- Same-Side Label Cooldown
- Label Offset
- Label Font Size
- Maximum Visible Labels
- Maximum Visible Connectors
Panel:
- Show Panel
- Panel Location
- Panel Theme
- Panel Font Size
🟣 Design Notes
The visual design is intentionally restrained:
- no regular divergence clutter
- no multi-oscillator table overload
- no unnecessary signal spam
- no permanent background wash
- no oversized dashboard
- no generic zone engine detached from the core concept
The chart should stay readable while still feeling active and premium. Swing connectors explain where the hidden divergence came from. Pockets preserve the continuation area. Labels are offset from candles and controlled by cooldown settings.
✨ Summary
Hidden Divergence Continuation Zones [AGPro Series] is built for traders who want a cleaner way to study trend continuation through hidden divergence.
Instead of asking whether every oscillator disagreement matters, this tool asks a more specific question:
Is there a confirmed hidden divergence pullback inside a real trend, and did that structure create a continuation pocket worth tracking?
That focused question is what keeps the script distinct, lightweight, and visually clean.
🟦 Overview
Hidden Divergence Continuation Zones [AGPro Series] is a focused trend-continuation indicator built around one specific market behavior: hidden divergence that forms during a structured pullback inside an existing directional move.
Most divergence tools are built to search for reversals. They scan regular bullish and bearish divergence, print many labels, and often mix every oscillator event into the same visual map. This script intentionally takes a narrower lane. It does not try to be a general divergence scanner. It looks only for hidden bullish and hidden bearish divergence, because hidden divergence is most useful when the question is not "is the trend ending?" but "is the trend trying to continue after a controlled pullback?"
The result is a cleaner continuation framework:
- confirmed price swing structure
- RSI momentum displacement
- EMA and DMI trend filtering
- ATR-normalized quality scoring
- lower-intensity HDC Watch labels
- forward continuation pockets
- swing connectors
- trigger labels
- compact AGPro dashboard
The purpose is to make hidden continuation structure visible without filling the chart with every possible divergence mark.
🔹 What Makes This Different
This script is separated from both common public divergence tools and our existing AGPro divergence family by design.
It is not a multi-oscillator regular divergence stack. It does not score RSI, MACD, CCI, MFI, and OBV together. That lane is already covered by broader stack-style divergence tools.
It is not an OBV pressure divergence map. It does not study price-versus-participation disagreement through cumulative volume pressure.
It is not a trend dashboard with divergence added as a side feature.
Hidden Divergence Continuation Zones focuses on a single continuation workflow:
1. Confirm that the market has an active directional side.
2. Wait for a valid pullback swing.
3. Compare the new swing against the previous swing.
4. Accept only hidden divergence that supports continuation.
5. Draw a forward pocket from the continuation pivot.
6. Track whether price later triggers from that structure.
That narrow scope is the edge. The script is designed to avoid visual noise and avoid conceptual overlap.
🧭 Core Logic
Bullish hidden continuation:
- the trend filter must support a bullish continuation environment
- price must form a confirmed higher low
- RSI must form a lower low against that higher price low
- the two compared swings must be separated by enough bars
- the structure must be large enough relative to ATR
- the RSI displacement must clear the minimum threshold
- the final continuation score must pass the display threshold
Bearish hidden continuation:
- the trend filter must support a bearish continuation environment
- price must form a confirmed lower high
- RSI must form a higher high against that lower price high
- the two compared swings must be separated by enough bars
- the structure must be large enough relative to ATR
- the RSI displacement must clear the minimum threshold
- the final continuation score must pass the display threshold
The script uses confirmed pivots, so events appear only after the pivot is structurally available. This keeps the logic stable and prevents premature labels from appearing on incomplete swings.
📐 Continuation Score
Each qualified setup is graded with a 0 to 100 continuation score.
The score combines:
- ADX strength above the selected minimum
- ATR-normalized distance between the compared swings
- RSI displacement between the two pivot points
- whether the pullback sits in a continuation-relevant EMA area
- whether the fast and slow EMA structure remains aligned
The default thresholds are designed to keep the chart selective. Normal qualified events are shown as HDC+ or HDC-. Stronger events are shown as PRIME HDC+ or PRIME HDC-.
Lower-intensity confirmed hidden divergence candidates can also be displayed as HDC WATCH labels. These marks are intentionally softer: they add visual context and keep the chart informative, but they do not create continuation pockets or trigger tracking unless the full continuation threshold is reached.
🧩 Continuation Pockets
When a hidden continuation event qualifies, the script projects a forward pocket from the pivot area.
These pockets are not generic support and resistance boxes. They are continuation context zones tied directly to the hidden divergence pivot. Their job is to preserve the important pullback area on the chart after the label appears, so the user can see where the continuation structure was created.
Pocket height is ATR-based, which helps the zones adapt across symbols and timeframes. The number of visible pockets is capped, so older structures are automatically removed and the chart remains clean.
🎯 Trigger Labels
After a hidden divergence pocket is created, the script monitors a limited trigger window.
For bullish continuation, a trigger is printed only when price confirms above the pivot candle reference with the selected ATR buffer.
For bearish continuation, a trigger is printed only when price confirms below the pivot candle reference with the selected ATR buffer.
This keeps the workflow organized:
- hidden divergence creates the continuation pocket
- the pocket defines the structure
- the trigger label marks follow-through from that structure
⚙️ Dashboard
The AGPro panel is built for quick reading:
- Oscillator: current RSI value
- Trend Side: bullish continuation, bearish continuation, or neutral
- Swing Quality: none, building, qualified, or prime
- Continuation Score: latest event score
- Active Pocket: current pocket state and freshness
The first panel row follows the AGPro standard: one merged blue header row with only the script title. Panel location, panel theme, label font size, and panel font size are all adjustable from settings.
🧪 Practical Reading
A clean bullish continuation sequence usually looks like this:
1. Trend Side shows Bull Continuation.
2. Price pulls back and forms a confirmed higher low.
3. RSI makes a lower low at that swing.
4. A continuation pocket appears below/around the pullback area.
5. A trigger label appears only if price follows through during the trigger window.
A clean bearish continuation sequence usually looks like this:
1. Trend Side shows Bear Continuation.
2. Price pulls back and forms a confirmed lower high.
3. RSI makes a higher high at that swing.
4. A continuation pocket appears above/around the pullback area.
5. A trigger label appears only if price follows through during the trigger window.
The best use case is structured trend continuation study, especially when a trader wants to separate controlled pullbacks from random oscillator divergence noise.
🔍 Key Inputs
Trend Continuation Filter:
- Fast EMA Length
- Slow EMA Length
- EMA Slope Lookback
- DMI Length
- ADX Smoothing
- Minimum ADX
Hidden Divergence Engine:
- RSI Length
- Confirmed Pivot Length
- Minimum Pivot Separation
- Minimum Price Swing (ATR)
- Minimum RSI Displacement
- Minimum Continuation Score
- Prime Score Threshold
- Show HDC Watch Labels
- Watch Label Score
Continuation Pockets:
- Show Continuation Pockets
- Pocket Extension Bars
- Pocket Height (ATR)
- Maximum Visible Pockets
- Trigger Window Bars
- Trigger Buffer (ATR)
Visual Layout:
- EMA Backbone
- Swing Connectors
- Event Labels
- Same-Side Label Cooldown
- Label Offset
- Label Font Size
- Maximum Visible Labels
- Maximum Visible Connectors
Panel:
- Show Panel
- Panel Location
- Panel Theme
- Panel Font Size
🟣 Design Notes
The visual design is intentionally restrained:
- no regular divergence clutter
- no multi-oscillator table overload
- no unnecessary signal spam
- no permanent background wash
- no oversized dashboard
- no generic zone engine detached from the core concept
The chart should stay readable while still feeling active and premium. Swing connectors explain where the hidden divergence came from. Pockets preserve the continuation area. Labels are offset from candles and controlled by cooldown settings.
✨ Summary
Hidden Divergence Continuation Zones [AGPro Series] is built for traders who want a cleaner way to study trend continuation through hidden divergence.
Instead of asking whether every oscillator disagreement matters, this tool asks a more specific question:
Is there a confirmed hidden divergence pullback inside a real trend, and did that structure create a continuation pocket worth tracking?
That focused question is what keeps the script distinct, lightweight, and visually clean.
ملاحظات الأخبار
UPDATE NOTES - V1.1This update focuses on readability, visual hierarchy, label balance, panel structure, and cleaner hidden-divergence continuation interpretation.
The core purpose of the script remains unchanged.
This release improves how the existing hidden divergence continuation logic is presented, organized, and interpreted on the chart.
This script continues to function as an analytical and visualization tool.
It does not attempt to predict price direction or provide guaranteed outcomes.
------------------------
What Changed
------------------------
* Reworked the continuation pocket visual system.
The script still identifies trend-aligned hidden divergence structures using price pivots, RSI displacement, EMA trend context, DMI/ADX pressure, and continuation scoring.
* Added centered labels inside continuation pockets.
Qualified hidden divergence zones now include compact centered labels so the pocket itself communicates direction and score without relying only on external labels.
* Added an engine preset layer.
Swing / 4H is the balanced default, Daily Selective is cleaner and more selective, and Custom keeps direct control over the raw inputs.
* Added automatic sub-4H visual cleanup.
Charts below 4H now reduce watch-only labels, connector intensity, and retained historical structures by default while the core trigger engine remains active.
* Updated panel standards.
The public script title does not start with AG Pro, while the panel title keeps AG Pro branding. The panel header remains a single merged blue row.
------------------------
Visual Improvements
------------------------
* Improved chart readability by adjusting continuation zones, trigger labels, watch labels, swing connectors, and EMA backbone visibility.
* Reduced visual clutter to enhance first-glance interpretation.
* Refined visual hierarchy so Prime HDC events, qualified HDC events, watch states, and continuation triggers are easier to separate.
* Adjusted label placement to avoid overlap with candles by using ATR-based spacing.
* Added centered labels inside continuation pocket zones.
------------------------
Interface & Usability
------------------------
* Optimized panel layout for clearer information flow.
* Added panel location, theme, and font-size controls while keeping the panel visible by default.
* Added configurable label font size with Normal as the default.
* Added a Best View panel row to guide users toward the intended 4H / 1D interpretation profile.
* Added Auto Clean Sub-4H View to keep low-timeframe charts from becoming visually crowded.
------------------------
Behavior Notes
------------------------
This update does not change the core analytical purpose of the script.
The goal is to improve clarity and usability, not to introduce predictive behavior.
Users should interpret outputs the same way as before, but with improved visual structure, cleaner label density, centered pocket context, and stronger panel clarity.
The automatic sub-4H cleanup affects visual density only. It does not disable the core hidden divergence or trigger logic.
------------------------
Limitations Reminder
------------------------
The script remains a rule-based analytical tool.
Market conditions such as volatility, liquidity, timeframe compression, trend quality, and oscillator behavior may affect how hidden divergence pockets and trigger labels appear.
Outputs should always be interpreted within broader market context.
------------------------
Risk Reminder
------------------------
This script is for educational and analytical purposes only.
It does not provide financial advice or guaranteed trading outcomes.
Users remain responsible for their own decisions.
ملاحظات الأخبار
🔧 UPDATE NOTES - v1.2This update adds a continuation-rate proof and tidies the panel.
The core purpose of the script remains unchanged.
It continues to detect trend-aligned hidden divergence, build continuation pockets, track
triggers and score swing quality with the same engine.
This script continues to function as an analytical and visualization tool.
It does not attempt to predict price direction or provide guaranteed outcomes.
------------------------
What Changed
------------------------
- Continuation Rate proof layer
The panel now reports how often qualified continuation pockets historically reached their
continuation trigger before invalidating, shown with the sample count for transparency.
- Streamlined panel
The recommended-timeframe row was removed for a cleaner, distraction-free panel, and the
Continuation Rate now occupies that space.
- Trigger label separation
Continuation trigger labels now sit a little further from candles, so they no longer overlap
the hidden divergence event labels in busy areas.
- Honest, conservative counting
Each pocket is counted once, and a crossed invalidation is treated as a non-continuation
even on the same bar as a trigger touch, so the rate stays realistic.
------------------------
Visual Improvements
------------------------
- Reduced label overlap between triggers and divergence events
- Preserved continuation pockets, centered pocket labels and swing connectors
- Maintained the bull and bear color language with readable contrast
- Left the publication-ready chart layout intact
------------------------
Interface & Usability
------------------------
- Added a Continuation Rate row for an at-a-glance follow-through track record
- Reused the existing trigger window so no extra setting is required
- Kept the oscillator, trend, quality, score and active-pocket hierarchy
- Enhanced overall user experience without changing the core detection logic
------------------------
Behavior Notes
------------------------
This update does not change the core analytical logic of the script.
Hidden divergence detection, scoring, pockets and triggers are unchanged. The Continuation
Rate is a separate historical track-record layer and does not alter how events are detected.
------------------------
Limitations Reminder
------------------------
The script remains a rule-based analytical tool.
Market conditions such as volatility, liquidity, and timeframe differences may affect how
pockets, triggers and the rate appear.
Outputs should always be interpreted within broader market context.
------------------------
Risk Reminder
------------------------
This script is for educational and analytical purposes only.
It does not provide financial advice or guaranteed trading outcomes.
Users remain responsible for their own decisions.
ملاحظات الأخبار
Version 1.3 – Pocket Identity, Context Visibility and Trigger IntegrityThis update improves chart coverage and state clarity while preserving the script’s hidden-divergence continuation model, scoring framework, alerts, and historical continuation-rate proof.
• Coupled every visible continuation pocket with its centered identity label. Disabling labeled pockets now hides the pocket and its label together, so the chart cannot retain an anonymous zone.
• Added confirmed, cooldown-controlled Bull Continuation and Bear Continuation context badges. These labels identify genuine trend-state transitions without presenting them as hidden-divergence events.
• Added an enabled-by-default close-confirmation gate for continuation triggers and made invalidation loss-first when both boundaries are challenged on the same bar.
• Separated Pocket State from Last Event in the panel and cleared expired score and quality memory after the configured window, preventing old events from appearing current.
• Refined trigger wording to distinguish HDC confirmations from general trend-context labels while retaining the existing RSI, EMA, DMI/ADX, proof, and alert logic.
نص برمجي مفتوح المصدر
بروح TradingView الحقيقية، قام مبتكر هذا النص البرمجي بجعله مفتوح المصدر، بحيث يمكن للمتداولين مراجعة وظائفه والتحقق منها. شكرا للمؤلف! بينما يمكنك استخدامه مجانًا، تذكر أن إعادة نشر الكود يخضع لقواعد الموقع الخاصة بنا.

🧠 Trading Suite - Flagship Workflow
tradingview.com/script/XJmX3p98-Trading-Suite-AGPro-Series/
🔷 Crypto Setup Planner - Multi-Symbol Planner
tradingview.com/script/LgVRo7Ql-Crypto-Setup-Planner-AGPro-Series/
tradingview.com/script/XJmX3p98-Trading-Suite-AGPro-Series/
🔷 Crypto Setup Planner - Multi-Symbol Planner
tradingview.com/script/LgVRo7Ql-Crypto-Setup-Planner-AGPro-Series/
إخلاء المسؤولية
لا يُقصد بالمعلومات والمنشورات أن تكون، أو تشكل، أي نصيحة مالية أو استثمارية أو تجارية أو أنواع أخرى من النصائح أو التوصيات المقدمة أو المعتمدة من TradingView. اقرأ المزيد في شروط الاستخدام.
نص برمجي مفتوح المصدر
بروح TradingView الحقيقية، قام مبتكر هذا النص البرمجي بجعله مفتوح المصدر، بحيث يمكن للمتداولين مراجعة وظائفه والتحقق منها. شكرا للمؤلف! بينما يمكنك استخدامه مجانًا، تذكر أن إعادة نشر الكود يخضع لقواعد الموقع الخاصة بنا.
🧠 Trading Suite - Flagship Workflow
tradingview.com/script/XJmX3p98-Trading-Suite-AGPro-Series/
🔷 Crypto Setup Planner - Multi-Symbol Planner
tradingview.com/script/LgVRo7Ql-Crypto-Setup-Planner-AGPro-Series/
tradingview.com/script/XJmX3p98-Trading-Suite-AGPro-Series/
🔷 Crypto Setup Planner - Multi-Symbol Planner
tradingview.com/script/LgVRo7Ql-Crypto-Setup-Planner-AGPro-Series/
إخلاء المسؤولية
لا يُقصد بالمعلومات والمنشورات أن تكون، أو تشكل، أي نصيحة مالية أو استثمارية أو تجارية أو أنواع أخرى من النصائح أو التوصيات المقدمة أو المعتمدة من TradingView. اقرأ المزيد في شروط الاستخدام.