Daily Opening Range For Scalping
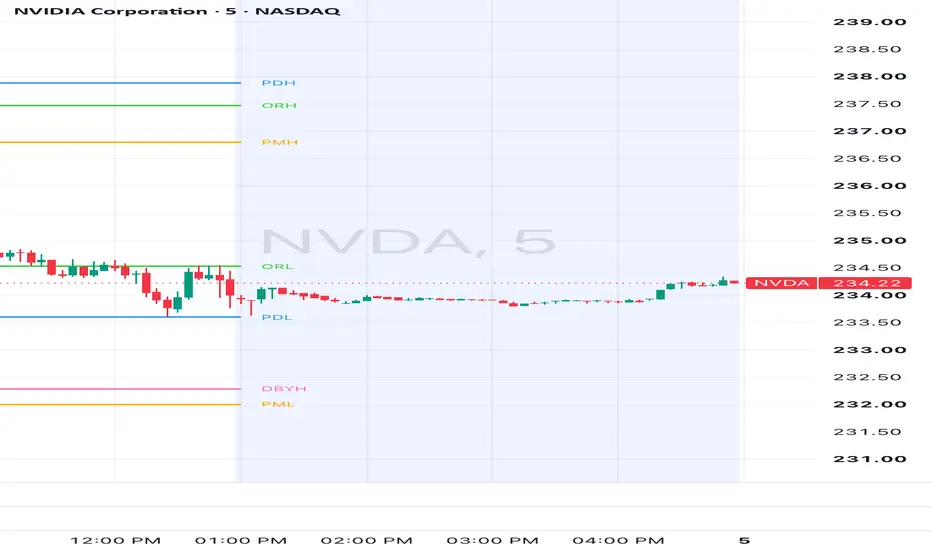
# Daily Scalping Key Levels — PDH/PDL, DBYH/DBYL, PMH/PML, ORH/ORL & Daily ATR
## Overview
This indicator is designed for **intraday traders and scalpers** who want important market reference levels automatically plotted on their chart.
Instead of manually marking previous highs/lows, pre-market levels, the opening range, and daily ATR targets, the indicator calculates and displays these levels for the current trading session.
The goal is to provide a clean intraday map showing areas where price may encounter **support, resistance, liquidity, breakouts, rejection, or increased trading activity**.
The indicator includes:
- 🔵 **PDH / PDL — Previous Day High & Low**
- 🩷 **DBYH / DBYL — Day Before Yesterday High & Low**
- 🟠 **PMH / PML — Pre-Market High & Low**
- 🟢 **ORH / ORL — Opening Range High & Low**
- 🟣 **Open + ATR / Open − ATR — Daily ATR Extension Levels**
---
## 🔵 PDH / PDL — Previous Day High & Low
**PDH = Previous Day High**
**PDL = Previous Day Low**
These blue lines represent the highest and lowest prices reached during the **previous completed regular trading session (RTH)**.
The indicator uses the regular New York session:
**9:30 AM – 4:00 PM ET**
These are important intraday reference levels because the previous day's extremes are often watched by day traders.
### Common ways traders monitor PDH/PDL
Price approaching these levels may produce:
**Breakout:**
Price moves through PDH or PDL and continues in that direction.
**Rejection:**
Price tests the level but fails to hold beyond it and reverses.
**Support/Resistance:**
A previous high may act as resistance, while a previous low may act as support.
**Liquidity Area:**
Previous session highs and lows can attract trading activity because stops and breakout orders may be clustered around these areas.
PDH/PDL should generally be treated as **areas of interest rather than automatic entry signals**.
---
## 🩷 DBYH / DBYL — Day Before Yesterday High & Low
**DBYH = Day Before Yesterday High**
**DBYL = Day Before Yesterday Low**
The pink lines represent the regular-session high and low from **two completed trading sessions ago**.
For example:
If today is Tuesday:
**PDH/PDL = Monday's RTH High/Low**
**DBYH/DBYL = Friday's RTH High/Low**
The indicator tracks completed trading sessions rather than simply subtracting calendar days, making these levels more useful around weekends.
### Why keep the second previous session?
Sometimes the prior day's range is relatively narrow or price quickly moves outside it. The high and low from two sessions ago can remain relevant as another historical reference area.
DBYH/DBYL can be useful for identifying:
- Older support/resistance
- Potential breakout areas
- Liquidity around prior swing extremes
- Rejection zones
- Price targets when PDH/PDL have already been broken
When PDH/PDL and DBYH/DBYL are located close together, the area may be worth additional attention because multiple historical levels are clustered nearby.
---
## 🟠 PMH / PML — Pre-Market High & Low
**PMH = Pre-Market High**
**PML = Pre-Market Low**
These orange lines track the highest and lowest prices during the pre-market session:
**4:00 AM – 9:30 AM ET**
The levels update during pre-market trading and are then available as reference points for the regular session.
### Why pre-market levels matter
The pre-market range shows where price traded before the regular market opened.
After 9:30 AM, traders can watch whether price:
- Breaks above PMH
- Breaks below PML
- Rejects one of the levels
- Retests a broken level
- Remains inside the pre-market range
A break followed by acceptance outside the pre-market range can provide useful information about intraday momentum, while repeated rejection may suggest that the level is acting as resistance or support.
---
## 🟢 ORH / ORL — Opening Range High & Low
**ORH = Opening Range High**
**ORL = Opening Range Low**
The green lines represent the high and low created during the first **30 minutes of the regular trading session**:
**9:30 AM – 10:00 AM ET**
The opening range is widely monitored because the first part of the session often establishes important intraday boundaries.
### Common interpretations
**Above ORH:**
Can indicate strengthening bullish intraday momentum when supported by price action and other confirmation.
**Below ORL:**
Can indicate strengthening bearish intraday momentum when supported by confirmation.
**Inside ORH/ORL:**
Price may be consolidating or trading without a clear directional break.
Traders may also watch for a breakout followed by a **retest of ORH or ORL** rather than immediately entering on the initial break.
---
## 🟣 Open + ATR / Open − ATR — Daily ATR Levels
These purple levels use the **Daily Average True Range (ATR)** to estimate potential price extensions from the regular-session opening price.
The default calculation uses:
**14-Day Daily ATR**
The levels are calculated as:
**Upper ATR Level = 9:30 AM Open + Daily ATR × Multiplier**
**Lower ATR Level = 9:30 AM Open − Daily ATR × Multiplier**
The default multiplier is **1.0**, but it can be changed in the indicator settings.
### Example
Suppose SPX opens at:
**6,700**
and its 14-day Daily ATR is:
**80 points**
The indicator would plot:
**Open + ATR = 6,780**
**Open − ATR = 6,620**
These levels provide context for how far price has traveled relative to its recent average daily movement.
Reaching an ATR level does **not** mean price must reverse. Strong trend days can exceed normal ATR ranges.
Instead, the levels can help traders evaluate whether price is relatively extended compared with recent daily volatility.
---
# How I Use the Levels for Intraday Scalping
The indicator is primarily a **market-map tool**, not a standalone buy/sell system.
I look for price interaction with these levels and then use additional confirmation before considering a trade.
Examples of confirmation can include:
**Price Action**
- Rejection candles
- Engulfing candles
- Break-and-retest setups
- Higher highs/higher lows
- Lower highs/lower lows
**Trend & Momentum**
- VWAP
- 9 EMA
- 21 EMA
- MACD
- RSI
**Participation**
- Volume expansion
- Increasing momentum
- Strong candle closes through a level
For example, price breaking PDH alone does not automatically create a long trade. A trader might instead wait to see whether price can **close above PDH, hold the level, and confirm momentum**.
---
# Level Confluence
One of the most useful features of plotting all these levels together is identifying **confluence**.
For example, suppose:
**PDH = 6,750**
**PMH = 6,752**
**ORH = 6,754**
Instead of treating these as three completely separate lines, the **6,750–6,754 area** can be viewed as a cluster of important reference levels.
The reaction around a cluster may be more informative than focusing on a single exact price.
---
# Quick Color Guide
🔵 **Blue — PDH / PDL**
Previous regular-session high and low.
🩷 **Pink — DBYH / DBYL**
Regular-session high and low from two completed trading sessions ago.
🟠 **Orange — PMH / PML**
Pre-market high and low from 4:00 AM–9:30 AM ET.
🟢 **Green — ORH / ORL**
Opening Range high and low from 9:30 AM–10:00 AM ET.
🟣 **Purple — Open ± ATR**
Potential daily volatility-extension levels calculated from the 9:30 AM opening price and Daily ATR.
---
## Intended Use
This indicator is designed primarily for **intraday trading, day trading, and scalping**.
It can help answer four important questions:
**Where are the important historical levels?**
→ PDH/PDL and DBYH/DBYL
**What levels did the market establish before today's open?**
→ PMH/PML
**What range did the market establish after the opening bell?**
→ ORH/ORL
**How extended is today's move relative to recent volatility?**
→ Open ± ATR
The levels are intended to provide **context and structure**, not automatic trade signals.
---
## Disclaimer
This indicator is provided for educational and informational purposes only. It does not constitute financial advice or a recommendation to buy or sell any security. Historical support, resistance, ATR, and session levels do not guarantee future price behavior. Traders should use their own analysis, confirmation, and risk-management rules.

إخلاء المسؤولية
لا يُقصد بالمعلومات والمنشورات أن تكون، أو تشكل، أي نصيحة مالية أو استثمارية أو تجارية أو أنواع أخرى من النصائح أو التوصيات المقدمة أو المعتمدة من TradingView. اقرأ المزيد في شروط الاستخدام.
إخلاء المسؤولية
لا يُقصد بالمعلومات والمنشورات أن تكون، أو تشكل، أي نصيحة مالية أو استثمارية أو تجارية أو أنواع أخرى من النصائح أو التوصيات المقدمة أو المعتمدة من TradingView. اقرأ المزيد في شروط الاستخدام.