CTZ Daily Fib Time Zones
Here's the TradingView description for CTZ Fib Time Zones, ready to paste:
```
CTZ Fib Time Zones
OVERVIEW
An automatic Fibonacci Time Zone tool anchored on the market's own cycle. It works like TradingView's Fib Time Zone drawing – 0 and 1 are two anchor points and lines are drawn at Fibonacci multiples of that span – but the anchors are found automatically from cycle lows and move forward every time a new cycle low is confirmed. No manual redrawing.
HOW IT WORKS
1. Cycle lows are detected automatically (swing lows with a minimum spacing). Default settings match the CTZ cycle tools:
• Daily (DCL): pivot 5, min 13 bars between lows
• Weekly (WCL): pivot 13, min 55 bars between lows
• Custom: your own values
Lengths are set for a Daily chart and auto-scale to any timeframe.
2. The unit (0 → 1) is taken from those lows:
• Low → next low (default): 0 = previous cycle low, 1 = last cycle low. The unit is one full cycle.
• Low → high: 0 = last cycle low, 1 = the cycle high since. The unit is the advance.
3. Zone lines are drawn at Fibonacci multiples of the unit: 0, 1, 2, 3, 5, 8, 13 (editable).
4. Optional ratio lines at 1.382, 1.618 and 2.618 (editable).
5. When a new cycle low confirms, everything re-anchors to the latest cycle.
READING THE LINES
Time lines mark WHEN a turn is likely, not which way.
• Zone lines (2, 3, 5…) in Low → next low mode are whole cycles from the last low, so they are the expected next cycle lows if the rhythm holds. Zone 2 (highlighted) is the next one.
• Ratio lines (1.382, 1.618, 2.618) fall part-way through a cycle and can mark a high or a low:
– price falling into the line → watch for a low
– price rising into the line → watch for a high
– a left-translated (LTR) cycle favours lows, a right-translated (RTR) cycle favours highs
Use the dates as appointments and confirm the turn with price, order flow or volume.
WHAT YOU SEE ON THE CHART
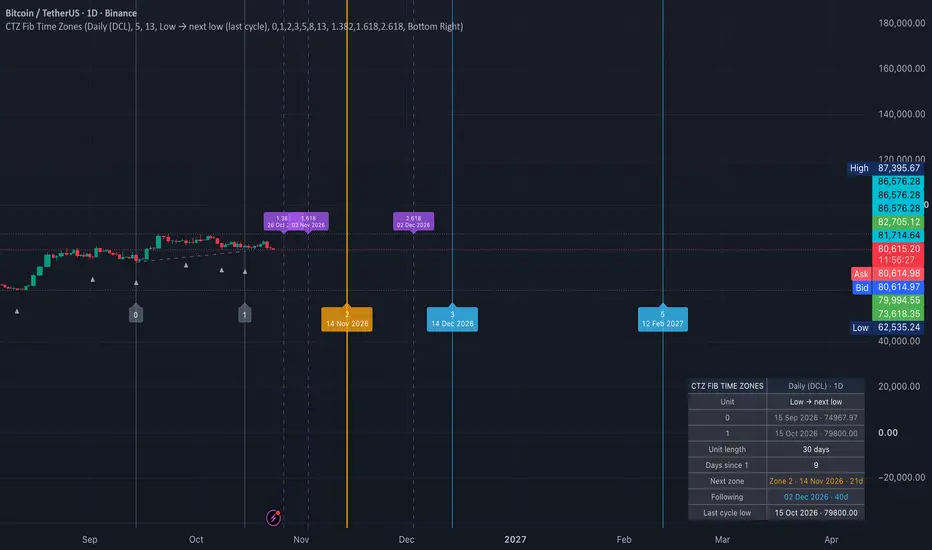
• Grey lines 0 and 1 – the anchors, joined by a dashed line like the TradingView tool
• Orange line – the next zone (expected next cycle low in Low → next low mode)
• Blue lines – further Fibonacci zones, labelled with their number and date
• Purple dashed lines – Fibonacci ratio lines
• ▲ markers – detected cycle lows
DASHBOARD
• Cycle and timeframe
• Unit mode
• Date and price of anchors 0 and 1
• Unit length in days
• Days since anchor 1
• Next zone (number, date, days away)
• Following zone
• Last cycle low
HOW TO USE IT
• Run it on the Daily chart for daily-cycle timing, or set Cycle to Weekly for the bigger picture.
• Look for zone dates that line up with other timing tools (cycle projections, Fibonacci time clusters, key events) – overlapping dates are the strongest windows.
• Check the dates again after each new cycle low: windows that keep appearing after re-anchoring are the most reliable.
SETTINGS
• Cycle: Daily (DCL), Weekly (WCL) or Custom pivot / spacing
• Auto-scale to chart timeframe
• Unit: Low → next low, or Low → high
• Fibonacci multiples (default 0,1,2,3,5,8,13)
• Ratio lines on/off and values (default 1.382,1.618,2.618)
• Colours, cycle low markers, dashboard and position
ALERTS
• Fib time zone reached
• New cycle low (zones re-anchored)
LIMITATIONS
• Cycle lows are confirmed by pivots, so the latest low appears a few bars after it forms and the zones re-anchor then.
• Time zones show likely turning points, not direction or size of the move.
• Cycles stretch and contract, so treat each date as a window of a few days, not an exact day.
This indicator is a tool for cycle timing and is not financial advice. Always use your own risk management.
```
```
CTZ Fib Time Zones
OVERVIEW
An automatic Fibonacci Time Zone tool anchored on the market's own cycle. It works like TradingView's Fib Time Zone drawing – 0 and 1 are two anchor points and lines are drawn at Fibonacci multiples of that span – but the anchors are found automatically from cycle lows and move forward every time a new cycle low is confirmed. No manual redrawing.
HOW IT WORKS
1. Cycle lows are detected automatically (swing lows with a minimum spacing). Default settings match the CTZ cycle tools:
• Daily (DCL): pivot 5, min 13 bars between lows
• Weekly (WCL): pivot 13, min 55 bars between lows
• Custom: your own values
Lengths are set for a Daily chart and auto-scale to any timeframe.
2. The unit (0 → 1) is taken from those lows:
• Low → next low (default): 0 = previous cycle low, 1 = last cycle low. The unit is one full cycle.
• Low → high: 0 = last cycle low, 1 = the cycle high since. The unit is the advance.
3. Zone lines are drawn at Fibonacci multiples of the unit: 0, 1, 2, 3, 5, 8, 13 (editable).
4. Optional ratio lines at 1.382, 1.618 and 2.618 (editable).
5. When a new cycle low confirms, everything re-anchors to the latest cycle.
READING THE LINES
Time lines mark WHEN a turn is likely, not which way.
• Zone lines (2, 3, 5…) in Low → next low mode are whole cycles from the last low, so they are the expected next cycle lows if the rhythm holds. Zone 2 (highlighted) is the next one.
• Ratio lines (1.382, 1.618, 2.618) fall part-way through a cycle and can mark a high or a low:
– price falling into the line → watch for a low
– price rising into the line → watch for a high
– a left-translated (LTR) cycle favours lows, a right-translated (RTR) cycle favours highs
Use the dates as appointments and confirm the turn with price, order flow or volume.
WHAT YOU SEE ON THE CHART
• Grey lines 0 and 1 – the anchors, joined by a dashed line like the TradingView tool
• Orange line – the next zone (expected next cycle low in Low → next low mode)
• Blue lines – further Fibonacci zones, labelled with their number and date
• Purple dashed lines – Fibonacci ratio lines
• ▲ markers – detected cycle lows
DASHBOARD
• Cycle and timeframe
• Unit mode
• Date and price of anchors 0 and 1
• Unit length in days
• Days since anchor 1
• Next zone (number, date, days away)
• Following zone
• Last cycle low
HOW TO USE IT
• Run it on the Daily chart for daily-cycle timing, or set Cycle to Weekly for the bigger picture.
• Look for zone dates that line up with other timing tools (cycle projections, Fibonacci time clusters, key events) – overlapping dates are the strongest windows.
• Check the dates again after each new cycle low: windows that keep appearing after re-anchoring are the most reliable.
SETTINGS
• Cycle: Daily (DCL), Weekly (WCL) or Custom pivot / spacing
• Auto-scale to chart timeframe
• Unit: Low → next low, or Low → high
• Fibonacci multiples (default 0,1,2,3,5,8,13)
• Ratio lines on/off and values (default 1.382,1.618,2.618)
• Colours, cycle low markers, dashboard and position
ALERTS
• Fib time zone reached
• New cycle low (zones re-anchored)
LIMITATIONS
• Cycle lows are confirmed by pivots, so the latest low appears a few bars after it forms and the zones re-anchor then.
• Time zones show likely turning points, not direction or size of the move.
• Cycles stretch and contract, so treat each date as a window of a few days, not an exact day.
This indicator is a tool for cycle timing and is not financial advice. Always use your own risk management.
```

إخلاء المسؤولية
لا يُقصد بالمعلومات والمنشورات أن تكون، أو تشكل، أي نصيحة مالية أو استثمارية أو تجارية أو أنواع أخرى من النصائح أو التوصيات المقدمة أو المعتمدة من TradingView. اقرأ المزيد في شروط الاستخدام.
إخلاء المسؤولية
لا يُقصد بالمعلومات والمنشورات أن تكون، أو تشكل، أي نصيحة مالية أو استثمارية أو تجارية أو أنواع أخرى من النصائح أو التوصيات المقدمة أو المعتمدة من TradingView. اقرأ المزيد في شروط الاستخدام.