Zen Open on High/Low (OOH/OOL) v3
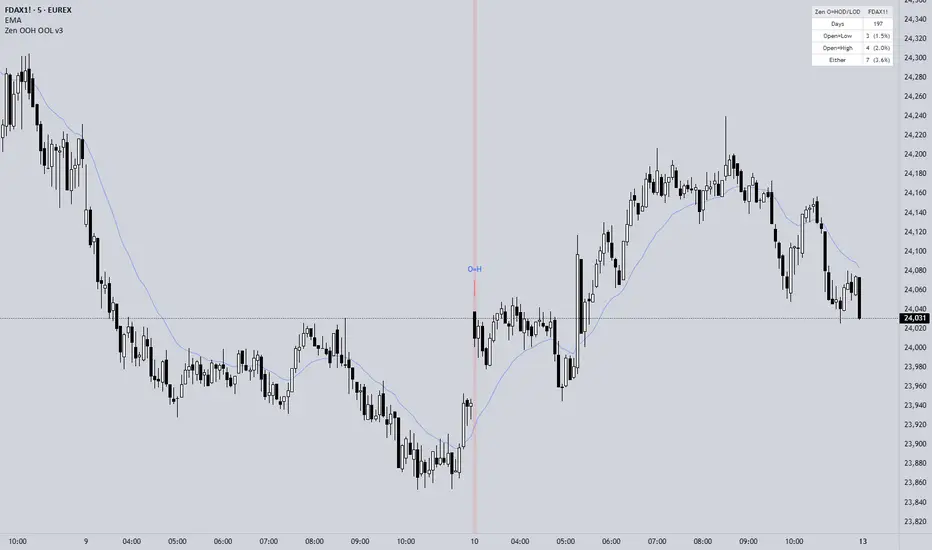
Zen RTH Open = HOD/LOD
This indicator flags the first bar of an RTH session when the open prints exactly on its high (Open = High) or exactly on its low (Open = Low) — the "shaved open."
█ WHY IT IS USEFUL
A shaved open on the first bar of the session is a rare structural event — on most liquid futures it occurs on only about 2% of sessions. Because the open and the extreme are literally the same tick, the opening level becomes an exact, unambiguous reference price rather than one buried inside a wick. Traders studying opening range behaviour, reversion to the open, or rare-event base rates can use this indicator to locate and count these events across their chart history.
█ WHAT IT MARKS
█ INPUTS
█ TIMEFRAME
Designed for 5-minute and 15-minute RTH charts. Will also run on 1-minute and 30-minute. Not recommended above 60 minutes — the first bar becomes too large a slice of the session for the structure to be meaningful.
█ ALERTS
Built-in alerts for both Open = Low and Open = High conditions, firing once per bar close.
█ LIMITATIONS
The indicator relies on a day-change detection for session start, so it should be used on an RTH chart where each trading day starts on a fresh bar. On 24-hour or ETH charts, the detected "open" will be the overnight open rather than the RTH open. Tolerance is set in ticks, so at tolerance 0 the match must be exact to the tick — opens that are one tick off the high or low will not flag.
Educational purposes only. Not investment advice.
This indicator flags the first bar of an RTH session when the open prints exactly on its high (Open = High) or exactly on its low (Open = Low) — the "shaved open."
█ WHY IT IS USEFUL
A shaved open on the first bar of the session is a rare structural event — on most liquid futures it occurs on only about 2% of sessions. Because the open and the extreme are literally the same tick, the opening level becomes an exact, unambiguous reference price rather than one buried inside a wick. Traders studying opening range behaviour, reversion to the open, or rare-event base rates can use this indicator to locate and count these events across their chart history.
█ WHAT IT MARKS
- Green up arrow and translucent green highlight when Open = Low on the first bar
- Red down arrow and translucent red highlight when Open = High on the first bar
- Stats table (top right) showing Days, Open=Low, Open=High and Either across the visible chart history, with percentages
█ INPUTS
- Tolerance (ticks) — 0 for exact shaved opens, raise to loosen the match
- Highlight opening bar — translucent one-bar background band, transparency adjustable
- Show arrows and labels — toggle chart markers
- Stats table — toggle the running tally
█ TIMEFRAME
Designed for 5-minute and 15-minute RTH charts. Will also run on 1-minute and 30-minute. Not recommended above 60 minutes — the first bar becomes too large a slice of the session for the structure to be meaningful.
█ ALERTS
Built-in alerts for both Open = Low and Open = High conditions, firing once per bar close.
█ LIMITATIONS
The indicator relies on a day-change detection for session start, so it should be used on an RTH chart where each trading day starts on a fresh bar. On 24-hour or ETH charts, the detected "open" will be the overnight open rather than the RTH open. Tolerance is set in ticks, so at tolerance 0 the match must be exact to the tick — opens that are one tick off the high or low will not flag.
Educational purposes only. Not investment advice.

إخلاء المسؤولية
لا يُقصد بالمعلومات والمنشورات أن تكون، أو تشكل، أي نصيحة مالية أو استثمارية أو تجارية أو أنواع أخرى من النصائح أو التوصيات المقدمة أو المعتمدة من TradingView. اقرأ المزيد في شروط الاستخدام.
إخلاء المسؤولية
لا يُقصد بالمعلومات والمنشورات أن تكون، أو تشكل، أي نصيحة مالية أو استثمارية أو تجارية أو أنواع أخرى من النصائح أو التوصيات المقدمة أو المعتمدة من TradingView. اقرأ المزيد في شروط الاستخدام.