SignalMaster Pro V2.0 - Premium Trading System
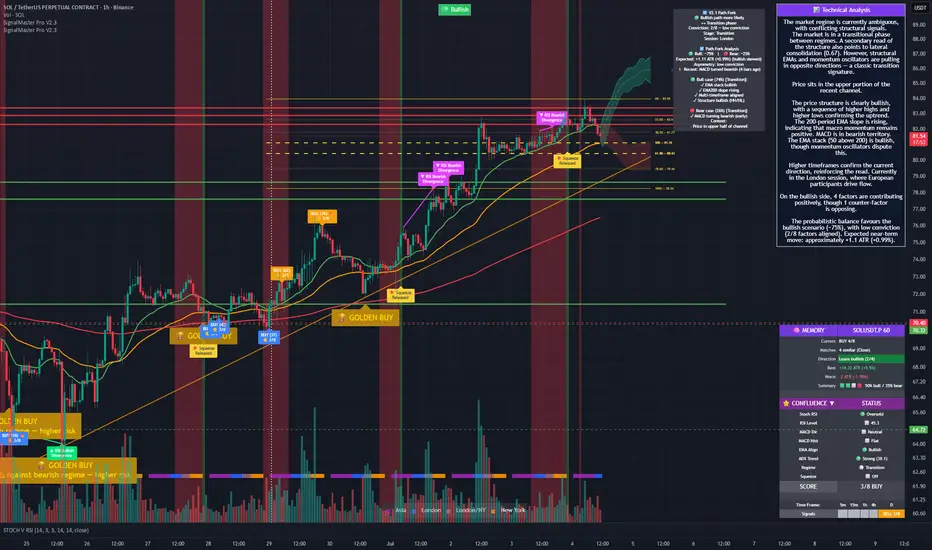
SignalMaster Pro V2 builds on the free version with ten new professional-grade features designed to transform a reliable signal generator into a complete trading dashboard. Each feature is independently toggleable and fully configurable, allowing traders to customize the tool to their strategy, timeframe, and style.
Below is a detailed breakdown of every premium feature included in this upgraded version.
---
🔒 1. Automatic Risk Management (Stop Loss & Take Profit)
What it is
When a BUY or SELL signal is generated, the indicator automatically draws Stop Loss and three Take Profit levels directly on the chart. All levels are calculated based on the current ATR (Average True Range), ensuring they adapt to the real volatility of each asset rather than using fixed percentages that break on different markets.
The Stop Loss uses a configurable ATR multiplier (default 1.5×), and the three Take Profits use Risk-Reward ratios of 1:1, 1:2, and 1:3 by default — all adjustable in the settings.
Key benefits
Removes emotional guesswork from trade planning. You no longer need to calculate SL/TP manually before every entry.
Adapts automatically to the instrument's volatility — works the same way on BTC as on EUR/USD or a low-volatility stock.
Gives the trader a clear visual of the complete trade setup from the moment the signal appears, enabling instant go/no-go decisions.
Example of how to use it in a trade
A BUY signal prints on EUR/USD at 1.0850. The indicator immediately draws:
🛑 SL at 1.0835 (1.5 × ATR below entry)
✅ TP1 at 1.0865 (1R — close 33% of position)
✅ TP2 at 1.0880 (2R — close another 33%)
✅ TP3 at 1.0895 (3R — close final 34%)
The trader enters the full position at market, places these exact levels on their broker, and walks away. As price hits TP1, they take partial profit and move SL to breakeven. The system runs itself.
---
⭐ 2. Confluence Scoring System (8-Factor Validation)
What it is
Instead of treating every signal equally, the indicator evaluates 8 independent technical factors on every candle and assigns each signal a confluence score from 0 to 8. A signal with 6/8 confluence is statistically far more reliable than one with 3/8. You can set a minimum confluence threshold — signals below that threshold are filtered out and never appear on the chart.
Conviction-based visual gradient: signal labels are colour-coded by the score itself — bright green/red for 7-8/8 A+ setups, medium green/red for 5-6/8 strong setups, blue/orange for 3-4/8 moderate setups, and muted gray for 1-2/8 weak setups. The conviction value is displayed directly in the label (⭐ 6/8) with larger label size when the score is ≥ 6. A secondary 🔥 fire glyph is added next to the RSI value when the RSI was in an extreme zone (oversold for BUY, overbought for SELL) at signal time — giving two independent quality signals in one label without visual confusion between the star (used for the confluence score) and the extreme-RSI marker.
The Stochastic RSI factor uses a five-zone classification instead of binary on/off: extreme oversold (below 10), bullish zone (10–30), neutral (30–70, the purple band), bearish zone (70–90), and extreme overbought (above 90). Both extreme and zone readings contribute +1 to the confluence score in their respective direction — so the score faithfully reflects the indicator's visible state rather than only extremes.
Key benefits
Dramatically reduces false signals. Instead of taking every BUY/SELL, you only see the high-quality ones your filter allows.
Gives an objective quality rating for every signal, removing the mental overhead of manually cross-checking multiple indicators.
The colour gradient makes conviction readable at a glance — a trader can scan the chart and instantly spot the A+ setups without reading the score numbers. No more confusion where a blue 5/8 signal looks weaker than a green 3/8 signal.
The score is based on historical data at the moment of the signal — it's not a retroactive adjustment. A 7/8 signal from last week really had 7 factors aligned when it fired.
Example of how to use it in a trade
A trader sets the minimum confluence to 5/8 in the settings. During the session, the indicator generates 4 raw BUY conditions on BTC:
Signal 1: 3/8 confluence → filtered out, no label shown
Signal 2: 5/8 confluence → shown on chart in medium green, trader considers entry
Signal 3: 4/8 confluence → filtered out
Signal 4: 7/8 confluence 🔥 → shown with larger bright-green label and a fire glyph indicating
RSI was also in extreme oversold — highest conviction entry possible
By filtering at 5/8, the trader skipped the two weakest setups that would likely have been false signals, and took two high-quality entries. Win rate improves because weak setups never reach their eyes.
---
📊 3. Automatic Divergence Detection (RSI & MACD)
What it is
The indicator automatically scans for and draws both RSI and MACD divergences directly on the chart. Bullish divergences (price makes lower low, indicator makes higher low) are marked with solid green lines and a label reading "▲ RSI Bullish Divergence" or "▲ MACD Bullish Divergence". Bearish divergences (price makes higher high, indicator makes lower high) are drawn in magenta with "▼ RSI Bearish Divergence" / "▼ MACD Bearish Divergence" labels.
Detection uses configurable pivot lookback periods and a maximum lookback range to avoid matching divergences on unrelated historical pivots. RSI divergences use solid lines; MACD divergences use dashed lines for visual distinction.
Key benefits
Divergences are one of the most powerful reversal signals in technical analysis, but manually spotting them requires constant attention and chart comparison. This automates the process completely.
Catches early warning signs of trend exhaustion before price actually reverses, giving the trader a head start on the best entries.
When a divergence coincides with a BUY/SELL signal, the probability of success jumps significantly — the indicator allows visual confirmation of this confluence in real time.
Example of how to use it in a trade
BTC is making a strong uptrend, pushing to new highs at $72,000. However, the indicator draws a magenta dashed line labeled "▼ MACD Bearish Divergence" connecting two price peaks. The trader notices the warning and tightens their trailing stop on open longs. Two candles later, a SELL signal with 6/8 confluence prints on the second peak. The trader opens a short, using the divergence + signal combination as the strongest possible confirmation. Price then collapses to $69,500, hitting TP2.
---
🔀 4. Market Regime Filter (Trend vs Range)
What it is
The indicator continuously classifies the current market into one of three regimes: Bullish Trend, Bearish Trend, or Ranging. Classification uses a combination of ADX strength (to detect if a trend exists at all) and EMA50 slope with EMA20/50 cross (to determine direction). The result is displayed in the confluence panel and optionally colors the chart background subtly.
An optional filter can be enabled that suppresses reversal-style signals during strong trends — for example, it won't show a BUY signal during a confirmed Bearish Trend, because reversal signals tend to fail when the broader trend is against them.
Key benefits
Reversal indicators like Stoch RSI work beautifully in ranging markets but get destroyed in strong trends. The regime filter prevents the worst losing setups automatically.
Gives the trader instant situational awareness: "Am I trading with the market or against it?" — a question most traders fail to ask.
The optional filter is particularly valuable for traders who tend to "catch falling knives" during strong downtrends.
Example of how to use it in a trade
A trader is scalping EUR/USD. The panel shows 🔴 Bearish Trend (ADX 35, EMA slope negative). A BUY signal condition would normally appear based on Stoch oversold, but because the trader enabled "Filter Signals by Regime", the BUY is automatically suppressed. Twenty minutes later, price continues dropping another 40 pips — exactly the kind of loss the filter saved. When the regime later shifts to ⚪ Ranging, the filter allows reversal signals again and the trader catches a clean BUY at the range bottom.
---
🔔 5. Smart Alert System
What it is
The indicator includes a complete alerting infrastructure that replaces noisy "every signal fires an alert" behaviour with intelligent, filtered, contextually rich notifications. Rather than a single generic BUY alert, the system detects eleven distinct types of events — filtered BUY/SELL signals, RSI and MACD divergences, volatility squeeze releases, trend line breaks, trend line bounces, Fibonacci level reactions, exhaustion setups (reversal imminent), perfect setups (multiple factors aligned), stop loss and take profit hits, defensive warnings when a position faces opposition, and multi-timeframe composite alignment. Each event type can be individually toggled on or off.
A minimum confluence threshold filters BUY/SELL alerts by quality (default 4/8, configurable 1–8), so the trader only gets notified for signals above a chosen quality bar. Two contextual filters restrict alerts to specific market sessions (all / only London-NY overlap / only London or NY / exclude Asia off-hours) and specific market regimes (all / only trending / only ranging). This lets a trader who only trades the London-NY overlap silence all Asia-hour noise with one setting.
Every alert message is rich and actionable — it includes the ticker, timeframe, exact price, calculated stop loss and three take profit targets, confluence score with strength label ("Strong A+ setup" / "Moderate"), current market session, regime, and any relevant Fibonacci or trend line context. The trader can open Telegram or email and see everything needed to decide — entry, SL, TPs, context — without opening the TradingView chart.
Special alerts fire for rare high-probability conditions: the Perfect Setup alert only fires when a 6+/8 signal coincides with additional confirmation (divergence, squeeze release, exhaustion, or proximity to the 61.8% golden ratio). Defensive warnings alert when a recently active BUY is followed by a bearish divergence (or vice versa) — the system telling the trader that the setup may be failing. Stop Loss / Take Profit hit alerts notify when price reaches each level of an active signal, so trade management can happen without watching the chart.
Key benefits
Eliminates alert fatigue by filtering out low-conviction signals. A trader who sets minimum confluence to 5/8 automatically silences all 1/8–4/8 noise, keeping only setups that warrant attention.
Rich messages make alerts immediately actionable — the trader sees the exact SL, TPs, and context in the notification itself, reducing decision time from minutes to seconds.
Session and regime filters enable strategy-specific workflows — scalpers can filter to only London-NY overlap, trend traders can filter to only trending regimes, reducing cognitive load during non-relevant market phases.
Perfect Setup and defensive alerts surface the two rarest and most valuable market events: the confluence of multiple high-conviction factors (A+ entries) and early warnings that an active setup is failing (exit management).
Example of how to use it in a trade
A trader configures the alert system: minimum confluence 5/8, London-NY overlap only, Perfect Setup alerts enabled, defensive alerts enabled. During the London-NY overlap, an alert arrives on the phone: "🔥 PERFECT BUY SETUP — BTCUSDT 1H. Confluence: 7/8 (Strong A+ setup). Price: 72,450. Stop Loss: 71,825. Take Profits: 72,825 / 73,200 / 73,575. Session: London/NY Overlap. Near Fibonacci 61.8% (golden ratio)." The trader enters long immediately with the exact levels from the alert. Three hours later, another alert: "✅ TP1 Hit — Consider moving SL to breakeven." Twelve hours later: "🎯 TP3 Hit — Full profit zone reached." The entire trade was managed without opening TradingView — three alerts, clean 3R gain, no emotional decisions.
---
🌍 6. Market Sessions with High/Low Boxes
What it is
The indicator highlights the three major trading sessions (Asia, London, New York) with colored bars at the chart bottom (only shown on timeframes below 4H, where session context is relevant). A universal legend in the bottom-left corner identifies each session by color.
Additionally, the high and low of each session are drawn as colored boxes that span the exact width and price range of the session, allowing the trader to see precise session ranges as historical reference zones.
Weekly dividers (vertical dotted lines at each Monday's open) are also drawn to help identify the start of fresh weekly cycles.
Key benefits
Different sessions have distinctly different characteristics. Asia tends to be the quietest with lower volume and tighter ranges. London typically breaks the Asian range with increased momentum. New York often continues or reverses London's move with the highest volume of the day.
Session high/low boxes act as powerful reference levels. Price reactions at previous session extremes are among the most reliable intraday setups.
Weekly dividers help identify setups at the start of fresh weekly cycles, where institutional repositioning and stop hunting commonly occur.
Example of how to use it in a trade
A trader is watching GBP/USD on the 15m chart. The Asian session (purple box) built a tight range between 1.2650 and 1.2670 — only 20 pips. As London opens (blue bars begin), the trader watches for a breakout of this compressed range. When the London–New York overlap begins (roughly 13:00–16:00 UTC, where both sessions are active simultaneously), trading volume surges and price volatility increases sharply — this 3-hour window is widely considered the most liquid and volatile period of the entire trading day. Price breaks the Asian session high with a BUY signal from the indicator at 5/8 confluence. The trader enters long with SL just below the Asian box high (now acting as support), knowing that the London–New York overlap tends to sustain directional moves. TP2 is hit within the hour as momentum carries the breakout.
---
💥 7. Volatility Squeeze Detection
What it is
The indicator detects volatility compression using the classic Bollinger Bands inside Keltner Channels method. When the Bollinger Bands move inside the Keltner Channels, it signals that volatility is compressing and a large move is building. This state is shown as a subtle red background tint on the active candles.
When the squeeze releases (BB moves back outside KC), a flash of green background plus a "💥 Squeeze Released" label marks the exact candle where the compressed energy is expected to explode. A minimum duration filter prevents micro-squeezes from triggering false releases.
Key benefits
Squeeze releases are among the highest-probability setups for large moves — they precede breakouts, news-driven moves, and trend accelerations.
Most traders miss squeezes because they require constantly comparing two indicators. This automates the detection and makes it impossible to miss.
Combined with the confluence score and BUY/SELL signals, a squeeze release with directional confirmation is one of the strongest setups available.
Example of how to use it in a trade
A trader watching SPY notices the chart has had 15 consecutive candles with red-tinted background (active squeeze) — the market has been compressing for over an hour. Suddenly, a "💥 Squeeze Released" label appears together with a BUY signal at 6/8 confluence. The trader knows accumulated volatility is about to release, and the BUY signal tells them which direction. They enter long with a wider stop to accommodate the expected volatility and take a larger-than-normal position. Price explodes upward in the next three candles, hitting TP3 quickly with a 3R gain.
---
📊 8. Real-Time Confluence Dashboard
What it is
A live dashboard in the bottom-right corner of the chart shows the current state of all 8 confluence factors on every candle, updated in real time. Each factor displays a directional icon: 🟢 for bullish/favorable, 🔴 for bearish/unfavorable, or ⚪ for neutral. The overall score and dominant direction (BUY or SELL) are shown at the bottom with color coding: green for strong (≥6/8), yellow for moderate (≥4/8), gray for weak.
A mobile-friendly collapsed view is available via settings toggle, showing only the header and score row.
Below the confluence section, the multi-timeframe table shows BUY/SELL status across 5m, 15m, 1h, 4h, and D timeframes in real time.
The 8 Confluence Factors — In Detail
1. Stochastic RSI — Measures whether the asset is in an extreme oversold or overbought condition using a stochastic oscillator applied to the RSI itself. When both the %K and %D lines are below the oversold threshold (default 10), the factor turns 🟢 for BUY. When both are above overbought (default 90), it turns 🔴 for SELL. This is the primary signal trigger inherited from the free version.
2. RSI Level — Evaluates the raw RSI value against configurable overbought and oversold thresholds (default 65/35). When RSI drops below 35, the factor turns 🟢 indicating the asset may be undervalued. When RSI rises above 65, it turns 🔴 indicating potential overvaluation. Unlike the Stochastic RSI which measures relative extremes, this factor captures the absolute momentum state.
3. MACD Direction — Checks whether the MACD line is showing sustained negative momentum (3 consecutive bars decreasing while below zero) for a bullish setup, or sustained positive momentum (3 consecutive bars increasing while above zero) for a bearish setup. This contrarian logic identifies when selling pressure is exhausting itself (favorable for BUY) or when buying pressure is reaching its peak (favorable for SELL).
4. MACD Histogram Momentum — Detects the exact moment the MACD histogram changes direction. When the histogram turns upward after declining, it signals potential bullish momentum building (🟢). When it turns downward after rising, it signals potential bearish momentum (🔴). This factor catches momentum shifts earlier than the MACD line crossover, providing an early warning advantage.
5. EMA Alignment (20/50/200) — Evaluates the relationship between price and three key Exponential Moving Averages. The factor turns 🟢 when price is above the EMA 200 (long-term uptrend) or when price is above the EMA 50 with EMA 20 crossing above EMA 50 (intermediate uptrend confirmation). It turns 🔴 for the inverse conditions. This ensures signals align with the broader trend structure rather than fighting it.
6. ADX Trend Strength — Measures the strength of the current trend using the Average Directional Index. This factor is directional: it only turns 🟢 when ADX is above the threshold (default 25) AND the market is in a confirmed bullish trend. It turns 🔴 when ADX is strong AND the market is in a bearish trend. If ADX is weak (ranging market) or the trend doesn't match the signal direction, it stays ⚪ neutral. This prevents the ADX from inflating the score in the wrong direction.
7. Market Regime — Classifies the broader market context using a combination of ADX, EMA 50 slope, and EMA 20/50 alignment. Turns 🟢 only during a confirmed Bullish Trend, 🔴 only during a confirmed Bearish Trend, and ⚪ when the market is Ranging. This is strictly directional — a ranging market does not add a point to either BUY or SELL, keeping the score honest and consistent with the visual display.
8. Volatility Squeeze — Monitors the Bollinger Bands vs Keltner Channels relationship. When a squeeze is active (volatility compressing) or has just been released (volatility exploding), this factor contributes a point to the score. The icon color follows the dominant direction: 🟢 if more factors favor BUY, 🔴 if more favor SELL, ⚪ if neutral. A squeeze adds conviction because it indicates that the next move — whichever direction the other 7 factors point to — is likely to be amplified.
Key benefits
Provides real-time situational awareness without needing to look at individual indicators. One glance tells you everything.
Lets traders anticipate signals before they fire — if the score is climbing from 3/8 to 5/8 over recent candles, a strong signal may be imminent.
Every factor's icon accurately reflects its contribution to the score. The number of green dots always matches the BUY score, and red dots always match the SELL score — no hidden or silent contributions.
The mobile collapse toggle reduces screen clutter on phones while preserving the critical score information.
Example of how to use it in a trade
A trader is waiting for a setup on ETH. The dashboard shows score 2/8 with mostly neutral factors. Over 10 minutes, the trader watches the score climb: 3/8 → 4/8 → 5/8 BUY as factors turn green one by one (EMA Align, then RSI Level, then MACD Hist turning up, then Squeeze activating). Before an actual BUY signal even fires, the trader is already mentally prepared and has their order ready. When the signal finally prints at 6/8 confluence, the trader is the first to execute, getting the best possible entry price. They can also see at a glance that ADX and Regime are still neutral (⚪), telling them the trend hasn't fully committed yet — so they take a conservative position size and wait for a stronger trend confirmation before adding.
---
📐 9. Swing Trend Lines
What it is
The indicator automatically detects significant swing highs and swing lows on the chart using pivot detection (`ta.pivothigh(high)` and `ta.pivotlow(low)`) and draws trendlines connecting them. The upper trendline connects the two most recent swing highs (resistance), while the lower trendline connects the two most recent swing lows (support), forming a dynamic visual price channel that updates as new pivots are confirmed.
Lines always touch the wick (high/low extremes), never the candle body — ensuring they reflect true price rejection points. Both lines extend forward from the current bar (default 20 bars) and backward before the first swing (default 20 bars), giving traders immediate visual context on where price is heading and where it came from. The swing detection length (default 14 bars left/right) controls sensitivity — higher values detect fewer but more significant pivots. Color (default: orange), width, and style are fully configurable. The feature is disabled by default and can be enabled in settings when visual trendline analysis is needed.
Key benefits
Drawing trendlines manually is time-consuming and subjective. This automates the process using objective pivot detection, eliminating human bias and ensuring consistency across all timeframes and assets.
The price channel formed by the two lines instantly reveals the prevailing trend structure — ascending channel (bullish), descending channel (bearish), converging lines (triangle/wedge), or parallel channel (range). This structural context helps traders anticipate breakouts and choose entries wisely.
Combined with confluence scoring and BUY/SELL signals, a signal that fires at or near a trend line becomes a high-conviction setup — price is at a structural level with directional confirmation.
Example of how to use it in a trade
A trader is watching ETH on a 1H chart with Trend Lines enabled (swing length 14). The upper trend line is descending while the lower trend line is flat — forming a classic descending triangle pattern. Price approaches the lower line and simultaneously a BUY signal fires at 6/8 confluence. The trader recognizes that descending triangles at support with strong confluence are high-probability reversal setups. They enter long with a tight stop just below the lower trend line. Price bounces sharply off the support line and rallies to touch the upper trend line within 8 candles — the trader takes profit at the exact touch for a clean 2.5R trade. Without the Trend Lines, they would not have seen the triangle pattern forming or known the precise structural level to target for their exit.
---
🔢 10. Fibonacci Auto-Levels
What it is
The indicator automatically draws Fibonacci retracement levels between the most recent swing high and swing low detected by the same pivot system used in Trend Lines. Seven horizontal levels are plotted — 0% (swing high), 23.6%, 38.2%, 50%, 61.8%, 78.6%, and 100% (swing low) — creating a complete Fibonacci grid that updates dynamically as new swing points are confirmed.
The 50% and 61.8% levels are drawn thicker and more opaque, reflecting their greater significance in technical analysis — the 61.8% level (the golden ratio) is historically the most reliable zone for trend retracements. Each level includes a label at the right edge showing both the percentage and the exact price, so the trader never needs to calculate manually. Lines extend from the earliest swing point to a configurable number of bars beyond the current price (default 20), providing both historical context and forward projection. The feature uses the same swing detection length as Trend Lines, ensuring consistency between the two tools. Disabled by default — enable in settings when needed.
Key benefits
Drawing Fibonacci levels manually requires identifying the correct swing high and swing low, then dragging the tool precisely between them — a subjective and time-consuming process. This automates it completely using objective pivot detection, ensuring consistency across all timeframes and assets.
The 38.2%, 50%, and 61.8% levels are natural zones where price tends to pause, reverse, or accelerate during retracements. Having them automatically drawn means the trader never misses a key reaction level, even when switching between multiple charts and timeframes rapidly.
Combined with BUY/SELL signals and confluence scoring, a signal that fires at or near a Fibonacci level (especially the 61.8% golden ratio) becomes an extremely high-conviction setup — price is at a mathematically significant level with directional confirmation from multiple independent factors.
Example of how to use it in a trade
A trader is watching BTC on a 4H chart after a strong rally from $60,000 to $72,000. With Fibonacci Auto-Levels enabled, the indicator automatically detects these as the most recent swing low and swing high, and draws all retracement levels. Price begins to pull back. As it approaches the 61.8% level at $64,584, a BUY signal fires with 7/8 confluence — Stochastic RSI oversold, RSI at support, MACD turning, EMA alignment bullish, ADX strong uptrend, regime bullish, and squeeze building. The trader recognises this as a textbook golden ratio bounce setup with near-maximum confluence. They enter long with a stop just below the 78.6% level ($62,576) and target TP2 near the previous high. Price bounces sharply from the 61.8% level and rallies back to $71,000 within two days — a clean 3.5R trade. Without the Fibonacci levels, the trader would have had no objective reference for where the retracement was likely to find support.
---
🔀 11. Path Fork Analysis (BETA)
What it is
A dual probabilistic projection showing both the bullish AND bearish scenarios simultaneously, each weighted by its own calculated probability. Instead of committing to a single forecast like every other indicator does, Path Fork admits that the market is probabilistic — showing two coloured bands extending forward from the current candle, one green (bull case) and one red (bear case), with opacity proportional to each case's probability. The dominant case (higher probability) is drawn in full detail with the indicator's complete simulation logic; the minority case is rendered as a secondary simplified band with dotted outlines, narrower width, and proportionally reduced opacity — the "what if I'm wrong?" view made visible.
The probability calculation integrates all available signals: confluence scores (buy vs sell), divergence weights, RSI position, Stochastic RSI zone, channel position relative to trend lines, trend line touch strength, market regime, recent signal pressure, squeeze state with inferred direction, and EMA slope. These factors are summed, normalized to probabilities that total 100%, and clamped between 10% and 90% so that no scenario is ever considered impossible — the market has been wrong about "certain" things too often.
The feature includes a Counter-Narrative mode that goes beyond visuals: for each case, the label lists the specific arguments FOR that direction. A 7/8 BUY with bullish divergence and RSI oversold shows 85% bull case with reasons like "Confluence 7/8 BUY, Bullish divergence active, RSI oversold (28), Recent BUY signal"; the bear case at 15% shows whatever contrary factors exist ("Price near upper trend line, Regime: bearish trend"). This forces the trader to consider both sides before acting — the only indicator that argues against its own dominant conclusion.
The label also displays Expected Value — the probability-weighted average price move in ATRs — and an Asymmetry rating (high conviction / moderate conviction / uncertain market). A 80%/20% fork with +3 ATR bull target vs -1 ATR bear target produces an Expected Value of +2.2 ATR with "high conviction" — a legitimate trade. A 55%/45% fork produces "uncertain market" — a signal to sit out. Traders can use Expected Value to size positions rationally: larger position on asymmetric setups, smaller or none on coin-flip conditions.
A Single Band legacy mode is preserved for traders who prefer the original single-scenario projection — useful for users upgrading from earlier versions and for quick visual reads where dual bands feel cluttered. The Path Fork mode is the default and recommended setting. A freeze mode (enabled by default) locks both projections in place once created so real price draws over them, making it easy to evaluate which case won and the accuracy of the probability weighting. The feature is disabled by default and can be enabled in settings — marked as BETA as the probability weighting continues to be refined.
Key benefits
The only indicator that visualises uncertainty. Every other forecasting indicator shows one direction with apparent certainty. Path Fork shows two — and the size difference between the bands tells the trader immediately whether this is a high-conviction setup (one band dominant, the other ghostly) or a genuinely undecided market (both bands visible with similar opacity). This is the honest reflection of how markets actually work.
Counter-Narrative forces self-discipline. By listing the arguments against the dominant direction in every label, the feature breaks the psychological trap of confirmation bias. A trader looking at a 75% bull case is reminded that 25% of the time the bear factors will win — and those specific factors are named. This is structurally different from every other indicator, which optimises for confirming your existing bias.
Expected Value enables rational position sizing. Instead of "take the signal or don't", traders can size proportionally to asymmetry. Expected Value of +2.5 ATR on a 80/20 fork warrants a larger position than Expected Value of +0.8 ATR on a 55/45 fork — even though both are "bullish" signals. The feature transforms each setup into a quantifiable probabilistic wager.
Example of how to use it in a trade
A trader is analysing BTC on the 1H chart. Price is in a bullish channel, RSI at 72 near the upper trend line (2 touches — moderately strong), with a fresh SELL signal at 5/8 confluence. Path Fork activates: the bull case draws a thin green band projecting +1.2 ATR (25% probability), the bear case draws a dominant red band projecting -3.5 ATR toward the lower trend line (75% probability). The Counter-Narrative label reads:
🟢 Bull case (25%): Regime: bullish trend, EMA slope up
🔴 Bear case (75%): Confluence 5/8 SELL, RSI overbought (72), Price near upper trend line, Recent SELL signal
Expected: -2.32 ATR (bearish skewed), Asymmetry: high conviction
The trader recognises this as a high-conviction bearish setup with quantified asymmetry. They enter short with tight stop above the upper trend line. Over the following 15 candles, price drops as projected, hitting TP2 for a clean 3R trade. The 25% bull case was a reminder that any given trade can fail — but the 75/25 asymmetry justified taking the position with above-average size. Without Path Fork, the trader might have seen the 5/8 SELL and hesitated (thinking "only 5/8 — weak signal") or taken the position without realising how strong the asymmetry actually was. With Path Fork, the probabilistic structure was explicit, enabling confident sizing.
---
🧠 12. Market Memory Panel
What it is
A real-time statistical memory of the current asset and timeframe. Every qualified BUY/SELL signal that fires is stored as a "trait fingerprint" — direction, confluence tier, divergence presence, squeeze state, Fibonacci proximity, trend line proximity, RSI extreme, session, regime — and after 20 bars of observation the price behaviour following that signal becomes part of the historical record. When a new signal fires, the system scans the memory for similar past setups and reports what price actually did in those cases — direction, magnitude, distribution, best case, worst case.
The panel reports pure price behaviour with no win/loss judgment, no profit promises, no performance tracking. It does not say "win rate 70%" because that would assume specific entry/exit rules. Instead it says "in 7 of 10 similar past setups, price moved bullish, with average +1.82 ATR over 20 bars". This is the empirical truth — the trader interprets it through their own strategy.
The matching uses 9 binary traits and three specificity levels: Exact (all 9 traits must match — rare but highly specific), Close (5+ of 9 traits — balanced default), or Broad (3+ of 9 — more samples but less specific). Look-ahead bias is rigorously prevented: signals are only counted in statistics once the observation horizon has passed, ensuring the indicator never uses future information to evaluate past setups. Recent signals are marked as "pending" and excluded from the match counts.
The display includes: current setup fingerprint, total matches found (split between exact and close), direction distribution (% of cases that went bullish), average move in ATR, best and worst cases, and a five-bucket distribution histogram (>+3 ATR, +1 to +3, -1 to +1, -3 to -1, <-3 ATR). A small per-signal label can also be attached to each new qualified signal, giving an at-a-glance summary right at the entry point.
Key benefits
Asset-specific intelligence in real time. Generic backtest stats apply averages across many markets — but BTC behaves differently from EUR/USD which behaves differently from AAPL. Market Memory builds a profile of how this specific asset on this specific timeframe responds to the signals the indicator generates. The trader gets data calibrated to their actual trading environment, not generic averages.
Empirical honesty without performance promises. By reporting only price behaviour (direction and magnitude observed), the feature avoids the regulatory and psychological traps of "win rate" claims. It tells the trader exactly what happened, leaving the interpretation in their hands. This is structurally different from indicators that imply guaranteed profitability through aggregated win-rate displays.
Sample-size transparency. Every statistic shows how many matches it's based on, with three specificity tiers. A trader looking at "3 similar setups, 67% bullish" understands this is a small sample with low statistical confidence; "23 similar setups, 78% bullish" tells a much stronger story. The feature never hides its sample size, never inflates confidence — it's honest about what it knows and doesn't know.
Example of how to use it in a trade
A trader is analysing ETHUSDT on the 1H chart. A new BUY signal fires at 5/8 confluence with bullish divergence and price near the 61.8% Fibonacci level. The Market Memory Panel scans the last 500 bars and finds 8 similar past setups (5+ traits matching). The panel shows:
Current: BUY 5/8 div fib
Matches: 2 exact + 6 close (Close)
Direction: 6/8 bullish (75%)
Avg move: +1.95 ATR over 20 bars
Best: +4.2 ATR, Worst: -1.6 ATR
Distribution: >+3: 2, +1 to +3: 4, -1 to +1: 1, -3 to -1: 1, <-3: 0
Per-signal tag attached to the BUY label: "📜 8 similar | 75% bull | avg +2.0 ATR"
The trader processes this data: 75% bullish bias is strong, but the worst case shows -1.6 ATR is possible — so they place SL at -1.5 ATR (tighter than worst case to avoid that specific historical outcome). The +1.95 ATR average target informs their TP1 placement (+1.5 ATR for high probability of being hit). They take the position with confidence informed by actual asset-specific data, not generic confluence theory. Trade reaches TP1 within the 20-bar horizon — consistent with the memory's prediction.
---
Summary
SignalMaster Pro V2 transforms the original free signal indicator into a complete trading system. Every feature was designed to solve a specific real-world problem traders face daily: signal quality, risk management, context awareness, multi-timeframe confirmation, and disciplined execution.
The indicator is fully modular — every feature can be independently enabled, disabled, and configured to match your strategy. Whether you scalp on the 5m or swing trade on the daily, whether you trade crypto, forex, stocks, or indices, the premium version adapts to your workflow rather than forcing you to adapt to it.
IMPORTANT CLARIFICATIONS TO THE DESCRIPTION
═══════════════════════════════════════════════
This update does not change the functionality of SignalMaster Pro V2. Its purpose is to provide explicit clarifications to the description above, covering three points required by the TradingView Script Publishing Rules: originality of the mashup, cleanliness of the published chart, and vendor requirements. Please read the following notes in addition to the main description.
━━━ 1. WHY THIS COMBINATION OF INDICATORS ━━━
Individual oscillators — RSI, Stochastic RSI, MACD — produce a high rate of false signals when used in isolation. This script does not simply overlay them. It transforms the baseline Stochastic RSI crossover into a high-probability entry by scoring every signal against 8 independent technical factors simultaneously:
1. Stochastic RSI crossover direction
2. RSI level zone (oversold / neutral / overbought)
3. MACD line direction
4. MACD histogram momentum
5. EMA alignment (20 / 50 / 200)
6. ADX trend strength
7. Market regime classification (bullish / bearish / ranging)
8. Volatility squeeze state (BB inside KC)
Each factor contributes 1 point to a final score from 0 to 8, displayed directly on the signal label. The combination is deliberate: these factors are statistically non-redundant. An RSI divergence captures what a Stochastic RSI crossover misses; ADX confirms whether a MACD direction has strength behind it; regime classification filters out ranging conditions where momentum signals historically underperform. Removing any one factor measurably reduces the signal quality of the remaining set.
On top of this confluence engine, the script introduces frameworks that do not exist in any public-domain code:
— Path Fork Analysis: dual probabilistic projection of the likely bullish and bearish paths ahead, based on historical behaviour of similar setups.
— Market Memory Panel: per-asset statistical memory that evaluates how past signals of the same confluence score on the same asset resolved (win rate, average R-multiple, time-to-target), producing an expected-value estimate for the current setup.
— Adaptive ATR-based risk management with automatic 1R / 2R / 3R take-profit projection the moment a signal fires.
— Multi-timeframe composite table aligning scores across five timeframes simultaneously.
These are not combinations of public indicators. They are original analytical frameworks built specifically for this script.
━━━ 2. ABOUT THE PUBLISHED CHART ━━━
The chart published alongside this script contains only outputs generated by SignalMaster Pro V2 itself. No third-party scripts or external indicators are displayed. Every visible element — the BUY / SELL signal arrows, the confluence score labels, the stop loss and take profit horizontal lines, the Fibonacci auto-levels, the swing trend lines, the regime background colouring, the session highlight boxes, the squeeze markers, and the divergence lines — is produced by this indicator and is documented in the main description. The chart is intentionally clean so that the indicator's contribution is directly identifiable.
━━━ 3. WHY THIS SCRIPT IS INVITE-ONLY ━━━
SignalMaster Pro V2 represents original research and development beyond what is available in public-domain code. Specifically:
— The 8-factor confluence scoring algorithm is not published elsewhere.
— The Path Fork Analysis probabilistic projection system is original.
— The Market Memory Panel (per-asset statistical expected-value engine) is original.
— The real-time adaptive ATR / 3-tier take-profit automation with risk-reward visualisation is an integrated system, not available as a standalone component.
— The multi-timeframe weighted composite alignment table is original.
— The regime-aware filtering layer is built specifically for this framework.
These features required substantial research, coding, and optimisation across multiple asset classes and timeframes. The ongoing maintenance, incremental updates, and direct support for active users justify the pricing model. Traders who prefer to rely only on public-domain components have access to the free version of this indicator, which is published openly on TradingView and generates the baseline Stochastic RSI + MACD signal without the premium confluence, risk-management, memory, or projection layers.
═══════════════════════════════════════════════
This release focuses on accuracy refinements, visual polish, and critical conceptual fixes surfaced from post-launch usage across multiple timeframes and assets.
Accuracy & Logic Fixes
Wick-based SL/TP detection — Stop Loss and Take Profit 3 closure now trigger the moment price touches the level, using wick-based detection (low/high) instead of close-based. This matches how real broker stop and limit orders actually execute, eliminating the misleading state where the visual trade stayed open after a wick had already stopped out the trader's real position. Alert messages updated from "Price closed" to "Price touched" for consistency.
Path Fork tri-state dominant bias — When Bull and Bear probabilities are genuinely equal (absolute tie), the system no longer silently defaults to bullish. A new neutral state is introduced with its own handling throughout the rendering and labelling pipeline. In neutral ties the label displays ⚪ Direction indeterminate (tie), target becomes the midpoint of both scenarios, colouring switches to gray 60% transparent, and the minority band is skipped entirely. Honest reflection over false precision.
Channel position breakout/breakdown awareness — Corrected a conceptual bug where "Price near upper trend line" was still being labelled as bearish resistance even when price had already broken above the line. After a breakout the line's role flips — former resistance becomes support, former support becomes resistance. This flip is now consistently applied across four distinct states of channelPosition:
[0, 0.3) → within channel, near support (bullish)
(0.7, 1.0] → within channel, near resistance (bearish)
> 1.0 → broke above upper line (now support, bullish)
< 0 → broke below lower line (now resistance, bearish)
Affects probability scoring, TL strength weighting, priority tree scenarios (rally_up / correction_down), Path Fork bull/bear reasoning, and label text. Labels now display explicit messages like "Price broke above upper trend line (now support)" when applicable.
W/M timeframe exclusion for trend-dependent features — Trend Lines and Path Fork Analysis are now explicitly disabled on Weekly and Monthly timeframes. Linear trend lines between two swings become misleading at those horizons where macro structure dominates over short-term pivots. The Path Fork analysis, which depends on trend-line infrastructure, is disabled accordingly. Supported timeframes: 5m / 15m / 1h / 4h / 1D.
Stochastic RSI K-smoothing parameter exposed — The %K smoothing parameter is now a configurable input (default 3, matching TradingView's built-in Stoch RSI). Without this smoothing, raw %K is extremely volatile and would dip into overbought/oversold zones far more often than the visual Stoch RSI on the chart suggests — causing false signal triggers.
RSI OB/OS defaults adjusted to convention — Default Stoch RSI thresholds now 80/20 (matches TradingView standard) instead of 70/30. Derived "Extreme" thresholds automatically shift to user input +/- 5 points.
Visual & UX Refinements
Clean status line — All 151 input parameters now hidden from the chart's status line with display=display.none. The three EMAs (20, 50, 200) and four session markers use display=display.all - display.status_line to remain visible on the chart but not clutter the status area. Result: status line shows only essential price data, not a wall of parameter values.
Direction Row redesign — Replaced the previous numeric-only counts with a verdict-based format showing Mostly bullish (4/5), Mostly bearish, or Flat, using natural language interpretation across the five monitored timeframes.
Session legend repositioning — Moved from position.bottom_left to position.bottom_center to eliminate conflict with the Market Memory panel that occupies the bottom-left region on wider panels.
Configurable squeeze label offset — New input Squeeze Label Offset (ATR) (default 2.0, range 0.1–10.0) controls the vertical distance of the 💥 Squeeze Released label below the bar. ATR-based scaling keeps visual spacing consistent across BTC, altcoins, stocks, and forex. Tune as desired for your chart theme.
Market Memory — Audit Fixes
The Market Memory panel received a full audit addressing subtle correctness issues:
- Bucket boundary fix — Strong Bull / Bull / Neutral / Bear / Strong Bear thresholds now use strict comparison at edges, eliminating double-counting at exact boundary values.
- RSI threshold consistency — Memory fingerprint's RSI extreme trait now uses the same tighter Extreme thresholds (default 70/30) as Path Fork's mean reversion logic, ensuring coherent interpretation across features.
- Regime convention standardised — Bullish = +1, Bearish = -1, Ranging = 0 across all code paths (previously used different sign conventions in different places).
- Lookback computation — memoryLookbackBars correctly tied to the indicator's max_bars_back declaration, with graceful degradation on early chart bars when the historical buffer is not yet filled.
🔧 Scoring rebalance — Path Fork weights realigned to consensus hierarchy
(trend > location > momentum): Regime 1.5→2.0, Channel position 1.0→0.7
(reduces overlap with TL strength), Squeeze direction 2.0→1.5
(TTM Squeeze is directionless by design).
📊 RSI thresholds canonical — Default OB/OS moved from 65/35 to 70/30,
matching Wilder original (1978) and analyst consensus (Fidelity,
StockCharts, OANDA).
🎯 Divergence noise filter — New "Min Lookback Range" input (default 5)
filters micro-noise where close pivots accidentally form divergence
patterns. Aligned with TradingView built-in behaviour.
📚 Educational tooltips — SL multiplier, TP1 and TL Break Threshold now
explain reasoning and provide timeframe guidance, helping users adjust
with confidence instead of treating defaults as opaque.
Net effect: stronger trend conviction in probability splits, fewer false
divergence signals, settings users actually understand.
🎯 Path Fork: distinguishes real signals from forming setups
The Path Fork now differentiates between "Recent BUY/SELL signal" (label actually drawn in the last 5 bars) and "Bullish/Bearish setup forming" (technical conditions aligning but filtered out by confluence or regime — no label drawn). Previously, "Recent SELL signal" could appear based on raw conditions even when no real signal had fired, creating dissonance between what users saw on the chart and what the Path Fork described.
⚖️ Path Fork: low-conviction calibration
Reduced bullish/bearish bias in scenarios where no primary factor is aligned:
Squeeze weight reduced from 1.5 to 0.5 when both sides have confluence < 2 (squeeze breakout direction loses meaning when indicators are neutral)
Secondary factors (EMA slope) attenuated to 50% in low-conviction contexts
Damping threshold raised from 4 to 6 — the Path Fork now requires more robust evidence accumulation before claiming moderate conviction
Result: in sideways or indecisive markets, the Path Fork dampens much more aggressively toward 50/50 instead of generating 60/40 from noisy secondary factors.
🐛 Stoch RSI: zone threshold bug fix
The Stoch RSI Oversold Level and Stoch RSI Overbought Level settings are now respected across all calculations. Previously, the Confluence Score and Status Panel used hardcoded values (30/70) for the "Bullish zone"/"Bearish zone" detection even when users changed the thresholds — creating inconsistency between the main BUY/SELL signals and the confluence count.
Zone thresholds are now calculated dynamically: (oversold + 10) for bullish zone, (overbought - 10) for bearish zone. With defaults 20/80 behaviour remains identical (30/70). With custom settings, the entire system stays consistent.
## 🎨 New: Dashboard Layout — Right Stack
A new layout control has been added at the top of the settings — **🎨 Dashboard Layout** — with two options:
- **Custom (default)** — same behaviour as V2.0.3. Each panel (Confluence, Memory, MTF) uses its own individually-configured position. For users who prefer fine-grained control and have horizontal screen real estate to spare.
- **Right Stack** — all three panels stack vertically in the bottom-right corner, forming a single integrated column. Memory on top, Confluence in the middle, MTF at the bottom. Frees up the left side of the chart and concentrates all dashboard information in one coherent region. Recommended for small screens, multi-monitor setups with side-by-side charts, and price-focused workflows.
The layout choice does not affect calculations — only the visual presentation. You can switch at any time without losing data.
## 🧠 Memory Panel — Collapsed mode redesigned
The **Collapsed** mode of the Memory panel (accessible via `📱 Panel Size`) has been distilled to 7 essential rows for mobile and Right Stack use:
- **Header** — ticker and timeframe
- **Current** — active setup with flags (`BUY 6/8 div sqz 🔥`)
- **Matches** — number of similar cases found in memory
- **Direction** — directional verdict from past cases
- **Best / Worst** — extremes of the observed moves
- **Summary** — visual distribution bar (🟩⬜🟥) with percentages
Lookback, Avg move, full Distribution list, and Pending counter remain available in Full mode for desktop users.
## 🛠️ Fixes and improvements
- **Memory header consistency.** The Memory panel header no longer reads "No setup" while displaying match statistics below — a visible contradiction in V2.0.3 when the memory contained past setups but no live setup was forming. The header now describes the panel contents directly; the live setup indicator lives in the Current row, with consistent conventions across both modes.
- **RE10039 error fixed.** In Custom mode + Collapsed with multiple timeframes enabled, the panel failed with an out-of-bounds error when trying to write to columns that did not exist in the dedicated table. Resolved — the column count is now sensitive to the rendering target.
- **`Auto` option removed** from Panel Size settings. It was a silent alias for `Full` since V2.0.x, with no real device detection (Pine Script has no access to that information). Removed for clarity. Saved layouts using `Auto` automatically fall back to `Full`, preserving identical behaviour.
- **Internal refactor** to reduce token footprint in the script's main body, eliminating duplication in table rendering and creating headroom for future features without hitting the compiler limit.
## 🔄 Compatibility
No calculation changes. BUY/SELL signals, confluence scores, divergences, squeezes, Fibonacci, trend lines, sessions, and Path Fork all retain V2.0.3 logic unchanged. Saved layouts continue to work — all V2.0.3 settings are preserved.
The new **Dashboard Layout** setting defaults to `Custom`, ensuring V2.0.3 users notice no visual difference upon updating.
## 🔀 Path Fork — three new contextual warnings
The Path Fork analysis now surfaces three top-level warning lines whenever there is meaningful tension between what the system sees and what the user might intuitively expect. Each warning is purely informational — the underlying probabilities are not changed, but the conflict is named explicitly so the reader is not left guessing.
- **⚠️ MTF disagreement** — fires when the timeframe immediately above the current one points the opposite direction. A single `request.security` call fetches confluence and regime from the higher TF; the warning surfaces only when there is genuine direction disagreement, not minor differences. Reads e.g. `⚠️ MTF: 4h is bullish vs current is bearish`.
- **⚠️ Counter-signal** — fires when a recent BUY/SELL signal points one way but the Path Fork concludes the opposite at 60% or higher confidence. Reads e.g. `⚠️ Counter-signal: BUY just fired but Path Fork sees 66% bearish`. Honest acknowledgement that the system saw the signal and still expects the opposite move.
- **⚠️ Oscillators vs trend** — fires when both oscillators are in extreme zones (e.g. RSI low + Stoch oversold) but the Path Fork still leans the opposite way because regime, channel position, or ADX outweigh the momentum signal. Reads e.g. `⚠️ Oscillators oversold (RSI 32.4 + Stoch) but trend dominates`.
## 🎯 Confirmed-signal weighting
The Path Fork now distinguishes between a signal forming on the current live bar (which can still evaporate before the bar closes) and a signal already confirmed by a closed bar (a real market commitment). Confirmed signals from the last 1–3 bars receive a 1.5× weight boost in the recency factor, nudging the Path Fork toward the signal direction in borderline cases without overruling structural factors when they are strong. Live-bar signals retain their original weight.
## 🔒 Risk Management — two new discipline filters
Both opt-in, both disabled by default, both designed to filter noise rather than alter calculations.
- **Wait for bar close before drawing SL/TP** — when enabled, SL and TP levels are calculated and drawn only after the signal bar fully closes, anchored to the confirmed close. Eliminates the situation where SL/TP shift visually during a forming bar as the close moves tick by tick. Trade-off: 1 bar of delay before lines appear.
- **Only show SL/TP when aligned with Path Fork** — a discipline filter that suppresses SL/TP lines, calculations and Smart Alerts when the Path Fork disagrees with the signal direction above a configurable threshold. Threshold defaults to 55% (moderate alignment); slider goes 50–100 for users wanting stricter discipline. Requires Path Fork enabled — graciously inactive if Path Fork is turned off.
## ⚙️ Path Fork — defaults and ranges revised
- **Label Offset** default raised from 5 to 12 bars. The previous default placed the Path Fork label too close to Fibonacci labels, frequently overlapping. The new default keeps a comfortable distance by default while remaining adjustable in either direction.
- **Freeze Projection** default changed from `true` to `false`. The dynamic projection (updates every bar) is now the default behaviour — always reflects the latest market state. Freeze mode remains available as opt-in for users wanting to evaluate how past projections aged.
- **Range Size** maxval extended from 2.5 to 4.0. The previous ceiling matched the default, leaving no headroom to widen the projection band for highly volatile assets. Default of 2.5 unchanged, but users now have 60% more range in either direction.
## 🎨 Confluence panel — five-tier visual gradient
The RSI Level and Stoch RSI rows previously jumped abruptly between the directional state (Bullish/Bearish zone) and Neutral. A new intermediate tier `Bullish lean` / `Bearish lean` covers the previously-mute zone (30–45 / 55–70), preserving a soft directional cue without affecting the scoring calibration.
To make the distinction between voting and non-voting factors immediately legible, the panel now uses a **shape convention**:
- 🟢 / 🔴 (round) — votes that count toward the confluence score
- 🟩 / 🟥 / ⬜ (square) — visual context that does not vote
A user counting bullets in the panel to verify the SCORE only counts the rounds; squares are direction or status indicators that inform but do not weight the result.
## 🛠️ Other improvements
- **Sessions legend reordered.** The bottom-of-chart legend now reads `Asia | London | London/NY | New York`, matching the natural temporal sequence of trading sessions during a UTC day.
## 🔄 Compatibility
V2.0.5 is largely backwards-compatible, with one caveat worth noting:
The **confirmed-signal weighting boost** in the Path Fork (Section above) means the Bull/Bear probabilities for the same historical situation may be slightly different from V2.0.4. The change is meant to make the system more responsive to genuine market commitment — but for users running personal backtests or comparing screenshots across versions, the numbers will not match exactly when a recent signal sits 1–3 bars in the past.
All other calculations are preserved: BUY/SELL signal generation, confluence scoring, divergences, squeezes, Fibonacci, trend lines, and sessions retain V2.0.4 logic unchanged. Saved layouts continue to work — all V2.0.4 settings are preserved, and the two new Risk Management settings default to off, ensuring V2.0.4 users notice no behavioural difference upon updating.
## 📐 Trend Line touches — full audit and rebuild
The touch counter on trend lines was producing misleading numbers in V2.0.5: lines visibly tested several times read `0 touches`; lines extending only 30 bars somehow showed 5 historical touches. This release rebuilds the counting logic from the ground up.
- **Retroactive recount** — when a new swing point arrives and the line is redrawn, touches are recomputed from scratch by scanning back along the line's actual span and checking each historical bar against the current line's projection. The previous V2.0.5 logic incremented bar-by-bar AND reset the counter on every swing, producing counts that reflected only the post-swing window rather than the line's full rejection history.
- **Lookback bound to line length** — the scan distance is now limited to the line's visible reach (from the older anchor pivot extended back by the user's `Extend Backward` setting). Counting touches on bars *before* the line was even formed is no longer possible. Previously the algorithm scanned a fixed 100 bars regardless of whether the line existed there or not.
- **O'Neil convention adopted** — touch counts now exclude the 2 anchor pivots that *define* the line. A line is a hypothesis until something beyond its forming pivots confirms it, so the displayed count represents *confirming* touches only. This aligns with Bill O'Neil's classical "3-touches validate" rule (where the third touch is the first confirmation), and with what a trader sees visually when counting touches on a chart. Reading `Strong upper TL holding (2 touches)` now genuinely means two confirmations beyond the line's formation.
The U-curve trust function (`f_tlStrength`) is unchanged — its tier thresholds were already calibrated to confirming touches; only the input that flows into it is now correct. As a consequence, scoring contributions in the Path Fork are now coherent with what the trader sees visually.
## ⚖️ Trend Line weakening — directional flip
A trend line tested 5+ times is no longer evidence the line will *hold*; statistically it's evidence the line is about to *break*. The directional implication therefore inverts depending on which line is weakening:
- A weakening **lower** trend line (support fading) → likely break → **bearish** argument
- A weakening **upper** trend line (resistance fading) → likely break → **bullish** argument
Both the counter-narrative reasons and the underlying probability scoring reflect this. Previously, a weakening lower TL still appeared as a bullish factor in the Bull case section despite the line being on the verge of failing — an internal contradiction between what the system displayed and what the math implied. Resolved.
## ✅ Trend Line breaks — close confirmation required
The "Price broke above/below trend line" reasons (and their corresponding scoring contributions) now require `barstate.isconfirmed` — the bar must have actually closed beyond the line, not just wicked through intra-bar. A wick that pierces a trend line and reverses by close no longer counts as a break.
Both the textual statement in the counter-narrative and the scoring weight follow the same rule, eliminating the case where the label declared a break that the math did not score, or vice versa.
## 🎯 Squeeze release — proportional targets
When a volatility squeeze releases, the projected target now scales with the dominant side's confluence rather than being a fixed +6 ATR move. Specifically, the target is `3.0 + conviction × 0.5` ATR — so a 2/8 confluence squeeze projects ~4 ATR, a 6/8 squeeze projects ~6 ATR, and an 8/8 squeeze projects ~7 ATR.
The old behaviour was producing dramatic projections (+6 ATR / +7%) on weak setups (2/8 confluence) where the squeeze release was technically valid but the directional conviction was negligible. Calibrated to be more honest: a squeeze releases volatility, but the *amount* of volatility committed should reflect how clear the directional vote is.
## 🤔 Honesty damping — sharper in low conviction
The Path Fork's honesty damping (which softens probabilities toward 50/50 when no factor is decisive) is now more aggressive in low-conviction contexts:
- The threshold to trigger "low conviction" is now `max(buy, sell) < 3` — activates when the dominant side is fragile, not only when both sides are extremely weak.
- In low conviction, the damping divisor is raised from 6 to 9 — meaning the score must accumulate further before reaching full confidence.
The combined effect: weak setups with several minor factors aligned no longer produce 80% probabilities by accumulation. Path Fork explicitly admits uncertainty when the underlying signals are mostly secondary.
## 🔤 Wording — `signal_reversal` clarified
The textual reason for the `signal_reversal` scenario reads `Bullish/Bearish signal pressure contradicts EMA slope — momentum has turned, EMA still lags` instead of the V2.0.5 wording referencing a "recent BUY/SELL signal." The previous text implied a label was drawn, while the scenario actually fires from oscillator setup pressure even when the label was suppressed by other filters. Cosmetic but more honest.
## 🔄 Compatibility
V2.0.6 changes the calibration of three subsystems that flow into Path Fork probabilities:
- **Trend Line touches** are now correct (excluding pivots, lookback bound to line span). Probabilities for setups that depend on TL strength change accordingly — most visibly, lines that previously read 5+ touches (often inflated) now read 2-3, moving from the "weakening" tier to the "peak credibility" tier.
- **Squeeze targets** scale with conviction, so the same squeeze release on the same chart produces a different target ATR than V2.0.5 unless the confluence is exactly 6/8.
- **Honesty damping** is sharper in low conviction. Weak setups that previously produced 75-80% probabilities now produce 60-70%, with the rest of the probability mass distributed to the minority case.
Backtesting screenshots from V2.0.5 will not exactly match V2.0.6 in any of these conditions. The behaviour is intended to be more accurate, not different for the sake of it.
All other calculations are preserved: BUY/SELL signal generation, confluence scoring, divergences, squeezes (excluding target sizing), Fibonacci, sessions, and Risk Management retain V2.0.5 logic unchanged. Saved layouts continue to work — all V2.0.5 settings are preserved without modification.
## ⚖ Path Fork — combinatorial over-confidence resolved
V2.0.6's Path Fork could produce 85-90% conviction when several moderate factors aligned — for example, a squeeze release with 4/8 confluence + a recent signal + a nearby lower trend line + falling EMA slope. None of the individual factors carried strong conviction, but their accumulation pushed the displayed probability into a range the underlying evidence didn't justify. V2.0.7 introduces two complementary mechanisms to address this.
### Soft probability ceiling
The hard 10/90 clamp from V2.0.6 has been replaced by a smooth compression of extreme probabilities. Values above 0.75 (and symmetrically below 0.25) are now mapped through a tighter band:
- **0.75 → 0.750** (boundary; unchanged)
- **0.80 → 0.764**
- **0.85 → 0.778**
- **0.90 → 0.792**
- **1.00 → 0.820** (absolute max — no probability ever exceeds this)
The mapping is `0.75 + (p - 0.75) × 0.28`. Probabilities below 0.75 are completely untouched — moderate convictions in the 60-70% range are unaffected. The ceiling acts silently: no label tag is added, since the compression is a structural feature of the system rather than a specific signal about the current setup.
### Structural caps in over-extension
A second mechanism explicitly limits conviction when basic structural evidence visibly contradicts the directional claim. When RSI is above 75 *and* price has either broken the upper Bollinger Band or moved more than 3 ATR over the last 10 bars, bullish conviction is capped at 55%. The bear case is symmetric. This is decoupled from trend lines, which in sustained trends are frequently pathological or extrapolated; Bollinger Bands and ATR-normalised price travel are more reliable indicators of over-extension.
When this cap engages, the Path Fork label adds the tag `⚖ Over-extended — conviction limited by RSI + BB / ATR move` to make the user aware the probability has been deliberately reduced.
The cap can be toggled via a new input: `Path Fork: Limit conviction in over-extension` (default: on).
## 🎯 Visual target attenuation
When the soft ceiling or structural cap reduces bullProb, the projection band magnitude follows the same compression so the chart visual aligns with the (now lower) numeric conviction. A 0.86 → 0.79 probability cut also tightens both the bull and bear target distances by ~19% — a target previously reaching +5 ATR now reaches +4 ATR. When neither ceiling nor cap engages, projections behave exactly as in V2.0.6.
This addresses a coherence problem in V2.0.6: the projection band could rise dramatically toward a +5 ATR target while the displayed probability said 79%. The two narratives now match.
## 🔧 Squeeze weight rebalanced
The squeeze-release factor's contribution outside low-conviction contexts has been reduced from 1.5 to 1.0. In V2.0.6, a single squeeze release frequently dominated the Path Fork score — combined with 3-4 weaker factors aligned in the same direction, it was the largest contributor to the 85-90% probabilities described above. The new weight keeps squeeze releases as a meaningful factor without letting them anchor combinatorial over-confidence.
## 🔄 Compatibility
V2.0.7 alters three behaviours visible to the user:
- **Probabilities above 75% are compressed.** A V2.0.6 setup that read 86% bullish will now read approximately 78-79%. The directional conviction is preserved; only the magnitude of the claim is reduced. Setups in the 60-75% range are unchanged.
- **Projection bands shrink proportionally** when the ceiling or caps engage. Charts with very tall bullish or bearish projection wedges in V2.0.6 will show flatter wedges in V2.0.7 *only* when those wedges corresponded to over-confident probabilities.
- **The structural cap can force probabilities to 55/45%** in clear over-extension. This is rare (~2-4% of bars in trending markets) and labelled explicitly. The cap can be disabled via the new toggle if the user prefers V2.0.6 behaviour.
Existing alerts, signals, and trend line drawing are unchanged. Backtesting screenshots from V2.0.6 will not exactly match V2.0.7 in setups that previously triggered probabilities above 75%. The behaviour is intended to be more honest, not different for the sake of it.
## 🔀 Smarter Path Fork Analysis
The Path Fork engine has been completely rebuilt with a new probabilistic model based on **12 weighted factors** drawn from market structure (Weinstein stages), price action (Brooks), volume behaviour (Wyckoff), and momentum (Minervini).
The result is a more honest read of the market: instead of giving confident calls in unclear conditions, the engine recognises ambiguity and tells you when the market simply doesn't have a clear edge.
---
## 📊 Three new visual panels
### Path Fork Label (floating)
Now shows a complete breakdown of why the engine sees the market as bullish or bearish:
- The dominant state (High-conviction bullish, Bullish, Lean bullish, WAIT, Lean bearish, Bearish, High-conviction bearish, or Transition)
- Trajectory (Continuation, Reversal warning, or Transition phase)
- Conviction score (0–8 factors aligned)
- Current Weinstein stage classification
- Bull case and Bear case with active factors (✓) and contextual signals (·)
- The label automatically follows the winning projection path on the chart
### State Bar (top centre)
A clean, always-visible status bar showing the current market verdict at a glance. Configurable position (top centre, top left, top right, middle left/right).
### Technical Analysis Panel
A natural-language explanation of what's happening, written like a market analyst would describe it. Three lengths available (Compact, Medium, Extended) and configurable position. Reads structural context, momentum, oscillator state, and probabilistic balance — and tells you what move is statistically expected.
---
## 🎯 More organic projection bands
The minority (losing) path now reacts to the chart like the dominant path does:
- Responds to Fibonacci levels with overshoot dampening
- Reacts to trend lines (rejection or support)
- Feels squeeze release expansion
- Includes per-bar and cumulative volatility clamps
The result: both projection bands look like they belong to the same chart, not like one is a serious projection and the other is a straight line.
---
## ⚡ Confluence Panel — now consistent with the new engine
The CONFLUENCE panel's **EMA Align** and **Regime** rows now use the same structural classifications as the new Path Fork engine. No more contradictions between what the panel says and what the floating label says.
The SCORE number reflects exactly what you see in the panel above it.
---
## 🎨 New customisation settings
- **State Bar Position** — choose where the status bar sits on screen
- **Technical Analysis Position** — choose where the analysis panel appears
- **Narrative Length** — Compact / Medium / Extended
- **Label Tracks Winning Path** — automatic positioning that follows the dominant projection
- **Label Vertical Offset (ATRs)** — manual adjustment to avoid overlap with other chart elements (useful on Daily/Weekly timeframes)
- **Label Offset (bars)** — controls horizontal distance from the latest candle
---
## 🛠️ What stayed the same
All your existing setups continue to work exactly as before:
- Trading signals (BUY/SELL labels)
- Smart Alert system
- Memory Panel
- Multi-timeframe confluence
- Trend lines, Fibonacci, divergences, squeeze detection, regime backgrounds
V2.1 is purely additive — the new engine sits alongside the existing system, giving you a richer macro view without changing how signals fire or how alerts trigger.
---
## 💡 How to use V2.1 effectively
The Path Fork engine and the Technical Analysis panel are best used as **context layers** on top of your usual signal-based trading. Before taking a BUY or SELL signal, glance at:
1. **State Bar** — does the market verdict align with the signal direction?
2. **Path Fork Label** — what's the conviction level? Are factors aligned?
3. **Technical Analysis Panel** — does the structural narrative support the trade?
When all three agree with your signal, you have high-conviction confluence. When they disagree, the engine is telling you to wait for cleaner conditions.
A maintenance release refining V2.1 with smarter market reading and several fixes based on user feedback.
---
## 🎯 Stage sub-states
The Path Fork engine now distinguishes active vs transitional phases within the same Stage:
- **Stage 2: Established uptrend** vs **Stage 2: Topping out** — early warning when an uptrend's structure deteriorates before EMAs flip
- **Stage 4: Established downtrend** vs **Stage 4: Base building** — when a downtrend stabilises and structure begins recovering
Stage tag now appears in Bull/Bear case headers: `[Stage 2]`, `[Stage 4]`, etc. Only shown on TF ≥ 1h where the Stage classifier is reliable.
---
## 📊 RSI now reads in 5 zones
Replacing the old binary "above 60 = bullish" with the Connie Brown / Andrew Cardwell model:
- **Overbought (>75)** — exhaustion risk, bearish
- **Strong (60–75)** — trend confirming, bullish
- **Neutral (40–60)** — no signal
- **Weak (25–40)** — downtrend confirming, bearish
- **Oversold (<25)** — reversal bias, bullish
The narrative now warns of exhaustion when MACD and RSI agree but RSI is in an extreme zone.
---
## 📍 Price location is now stage-aware
In Stage 2 (uptrend), both extremes of the recent range are interpreted as bullish — near highs as trend extension, near lows as pullback opportunity. In Stage 4 (downtrend), both extremes are bearish — near lows as extension, near highs as bounce within trend.
Reflects how Brooks and Cardwell actually trade pullbacks and bounces. On lower timeframes, falls back to trend-following defaults to avoid false certainty.
---
## ⚡ Trade levels follow price
SL and TP labels (and lines) now advance automatically with new candles. The "candles drawing over labels" issue is fixed.
---
## 🔧 Other refinements
- Confluence Panel's EMA Align and Regime rows now use V2.1 classifiers — no more contradictions with the floating label
- SCORE number reflects exactly the rows displayed
- Path Fork label tracks the endpoint of the dominant projection band smoothly
- Long stage names break to a second line with subtle indentation
- Inactive (minority) projection band now reacts to Fibonacci, trend lines, and squeeze release
- Linguistic refinements: "entrenched" replaced by "baseline alignment" — less overconfident phrasing
- All input groups reorganised with consistent emoji icons and thematic ordering
- "Premium BETA" tags removed — features are production-ready
---
## ⚙️ Default settings updated
- Technical Analysis Panel position: **Top Right**
- Label Offset: **8 bars** (was 12)
- State Bar size: **normal** for better readability
---
*Fully compatible with V2.1 — no breaking changes. All existing setups, alerts, and signals continue to work exactly as before.*
A focused refinement release improving how the engine communicates regime information across timeframes.
---
## 🎯 Stage sub-states
The Path Fork engine now distinguishes between **active** and **transitional** phases within the same Stage:
- **Stage 2: Established uptrend** vs **Stage 2: Topping out** — early warning when an uptrend's structure deteriorates before EMAs flip
- **Stage 4: Established downtrend** vs **Stage 4: Base building** — when a downtrend stabilises and structure begins recovering
These sub-states catch trend maturation before the classifier flips Stage. A Stage 4 marked "Base building" tells you the downtrend may be exhausting — useful for positioning around potential reversals.
Long sub-state names break to a second line for cleaner display:
```
Stage 4: Base building
(downtrend — structure recovering)
```
---
## 🏷️ Stage tag in case headers
The Bull case and Bear case sections now show the current Stage in their headers:
```
🟢 Bull case (66%) [Stage 2]:
✓ EMA stack bullish
✓ EMA200 slope rising
🔴 Bear case (34%) [Stage 2]:
- No bearish factors detected
```
Quick contextual reference for how factors are being interpreted.
---
## 🔍 Honest epistemics on lower timeframes
Below 1h the Stage classifier isn't reliable enough to trust. The engine now reflects this honestly:
- **Stage line** disappears from the Path Fork label
- **Stage tag** disappears from Bull/Bear case headers
- **Narrative opening** uses neutral phrasing ("On this timeframe the price action shows...") instead of regime-specific language
- **"(inferred)" tags** removed entirely — either we know the Stage or we don't
On TF ≥ 1h everything works as before, with the new sub-state nuances available.
---
*Fully compatible with V2.1 / V2.1.1 — no breaking changes. All existing setups, alerts, and signals continue to work exactly as before.*
A focused refinement release improving how the engine communicates regime information across timeframes.
🎯 Stage sub-states
The Path Fork engine now distinguishes between active and transitional phases within the same Stage:
Stage 2: Established uptrend vs Stage 2: Topping out — early warning when an uptrend's structure deteriorates before EMAs flip
Stage 4: Established downtrend vs Stage 4: Base building — when a downtrend stabilises and structure begins recovering
These sub-states catch trend maturation before the classifier flips Stage. A Stage 4 marked "Base building" tells you the downtrend may be exhausting — useful for positioning around potential reversals.
Long sub-state names break to a second line for cleaner display:
Stage 4: Base building
(downtrend — structure recovering)
🏷️ Stage tag in case headers
The Bull case and Bear case sections now show the current Stage in their headers:
🟢 Bull case (66%) [Stage 2]:
✓ EMA stack bullish
✓ EMA200 slope rising
🔴 Bear case (34%) [Stage 2]:
- No bearish factors detected
Quick contextual reference for how factors are being interpreted.
🔍 Honest epistemics on lower timeframes
Below 1h the Stage classifier isn't reliable enough to trust. The engine now reflects this honestly:
Stage line disappears from the Path Fork label
Stage tag disappears from Bull/Bear case headers
Narrative opening uses neutral phrasing ("On this timeframe the price action shows...") instead of regime-specific language
"(inferred)" tags removed entirely — either we know the Stage or we don't
On TF ≥ 1h everything works as before, with the new sub-state nuances available.
Fully compatible with V2.1 / V2.1.1 — no breaking changes. All existing setups, alerts, and signals continue to work exactly as before.
A major refinement release across the probabilistic engine, trend line detection, signal qualification and visual filtering. Focused on improving the quality of what you see and act on, without changing the underlying signal logic.
---
## 🧠 Smarter probability engine
The probability synthesis has been rebuilt to communicate uncertainty more honestly:
- **Sigmoid (tanh) mapping** replaces the old linear scaling. Probabilities saturate smoothly — stacking a sixth bullish factor moves the verdict less than stacking the second one, matching the diminishing informational value of redundant evidence.
- **Volatility-aware expected move.** The Expected ATR shown in the Path Fork label now adapts to current volatility (vs the 50-bar average) and to the Stage character. Quiet regimes show contained moves; expanded regimes show larger ones; ranges (Stage 1/3/Transition) are damped vs trends (Stage 2/4).
- **Conviction normalised by data availability.** When volume isn't reliable, or no trend lines exist, the 0–8 conviction scale rescales — so a 3/8 score earned among 10 usable factors no longer looks weaker than a 3/8 among 12.
- **Low-conviction probabilities marked as approximate.** With conviction ≤ 2, the percentage shown rounds to the nearest 5 and gets a `~` prefix (e.g. `~60%`). Removes false precision when the underlying signal is genuinely uncertain.
---
## 📐 Best-fit trend line detection
The trend line system was rebuilt from the ground up. The old logic connected the two most recent chronological pivots and extrapolated — which produced lines between structurally unrelated points, extreme slopes, lines cutting through price, and zombie lines that lingered after breakouts.
The new system:
- **Stores the last 6 pivots per side** and selects the PAIR whose line scores best, replicating how a trader draws lines by hand
- **Scores by touches minus violations** with realistic thresholds (touch tolerance 0.35 ATR, gap of 3 bars between touches, 0.15 ATR violation margin)
- **Rejects invalid candidates** — slopes above 1.5 ATR/bar, violations beyond 15% of the span, or lines that have drifted more than 8 ATR away from current price
- **Invalidates by break** — three consecutive closes beyond a line by more than 0.5 ATR mark it broken; drawing stops and the band physics zero its strength until a fresh fit takes over
- **Hides unvalidated lines entirely** — if no pair passes validation, no line is drawn (the pivots remain for Fibonacci anchors)
---
## 🎚️ Auto-calibrated trend line settings
The ten technical inputs for pivot length (Left/Right per timeframe) have been replaced by a single selector:
```
Trend Line Detection: [Auto / Tight / Medium / Wide]
```
**Auto** (default) adapts pivot detection to the timeframe and current volatility regime — quiet markets widen pivots to capture macro structure; expanded markets shorten them to track the faster rhythm. Tight/Medium/Wide are fixed presets for traders who want explicit control without the jargon. Visual settings (colour, width, style, extension) remain user-controlled.
---
## ⚡ MACD early-momentum factor
MACD direction now reads momentum shifts a few bars earlier. When the histogram turns while the line is still on the wrong side but recovering, the factor contributes a half-signal (±0.5) and the label reads "MACD turning bullish (early)" or "MACD turning bearish (early)". Full ±1 still requires both line and histogram in agreement. Captures the start of reversals where most informational value lives.
---
## 📊 Continuous volume factor
Volume contribution now scales with the magnitude of the excess instead of being binary above the threshold:
- 1.3× average volume → ±0.5
- 2.0× and above → ±1.0
The direction still comes from the candle body and the reliability gate is preserved. Replaces the all-or-nothing previous behaviour.
---
## 🏗️ Recency-weighted structure score
The HH/HL/LH/LL detection now weighs pivot transitions by age — the most recent pair counts 0.35, the middle 0.25, the oldest 0.15. Today's structural decision should reflect today's structure more than three swings ago. The classifier output remains normalised to [-1, +1].
---
## 💥 Squeeze release quality filter
Volatility squeezes now communicate their **quality**:
- During each squeeze, the tightest BB/KC width ratio is tracked
- A release is marked **strong** when the compression was deep (ratio ≤ 0.75) or the squeeze lasted at least 2× the minimum duration
The "💥 Squeeze Released" label and green background now only show for strong releases — weak squeezes that barely entered the KC stop polluting the chart. The underlying logical squeeze (engine factor, band physics, alerts) is unchanged; only the visual display responds to quality.
---
## ⚠️ Surgical counter-stage warning
A new `⚠` symbol appears on BUY/SELL labels firing against the current market regime — but only when **two** conditions hold simultaneously:
- **BUY**: confirmed Stage 4 downtrend **and** Path Fork Bear probability > 60%
- **SELL**: confirmed Stage 2 uptrend **and** Path Fork Bull probability > 60%
The double condition keeps the warning surgical. A BUY during Stage 4 base-building with balanced probabilities stays clean; a BUY in pleno colapso with Bear 78% gets the flag. The probability is evaluated at the moment the signal fires and is permanent on that label.
Signal firing logic is unchanged — the warning is purely informational.
### Hide Counter-Stage Signals (off by default)
A new toggle in the Buy/Sell Signal Conditions group lets you hide flagged signals entirely. When enabled:
- The `⚠` BUY/SELL labels disappear
- Their SL/TP lines are not drawn
- The trade is not registered for risk-management tracking
Alerts and engine logic are unaffected. Useful for traders who only want to act on signals aligned with the macro context.
---
## 🔀 "What changed" tracker on the floating label
The Path Fork label now shows a recency line when a key factor has flipped in the last 10 bars:
```
⚡ Recent: MACD turned bullish (2 bars ago)
```
Tracks: MACD, RSI, EMA stack, structure, EMA200 slope. Tells you not just where the engine stands but what just moved — the marginal information that often matters most.
---
## ⚡ Urgent-event paragraph in the narrative
The Extended Technical Analysis narrative now leads with a dedicated paragraph for time-sensitive events when they're live:
- Volatility squeeze released
- Trend line broken
- Active divergence
These were previously buried mid-narrative. Now they sit immediately after the opening, where they belong.
---
*Fully compatible with V2.1.x — no breaking changes. All existing setups, alerts, and signals continue to work exactly as before.*
**A focused release built around a redesigned Golden Buy, an immediate divergence engine, and a Path Fork that now respects oscillator exhaustion.** This changelog covers what changed since V2.2.1 — the core V2.0.7 signal engine (base BUY/SELL, confluence scoring, ATR bands, MTF table) is untouched and behaves exactly as before.
---
## 🏆 Golden Buy — completely redesigned
The Golden Buy has been rebuilt from the ground up. The previous exhaustion-and-continuation model has been replaced by a cleaner, multi-timeframe oversold entry with a full set of optional filters you control.
**How it fires now:** the Golden Buy triggers on a **Stoch RSI oversold condition confirmed across two timeframes** — your current chart timeframe *and* the next lower one — so a single-timeframe wick doesn't set it off. The lower timeframe is selected automatically (e.g. 1H → 15m, 4H → 1H), with no configuration needed. It also fires whenever **RSI itself is oversold**, even if Stoch is not — either path alone is enough.
**New filters (all in the 🏆 Golden Buy group):**
- **Stoch Oversold level** — the Stoch RSI threshold both timeframes must be under (default 20).
- **Counter-Regime Guard** (on by default) — in a confirmed bearish regime, the Golden Buy additionally requires RSI oversold, not just Stoch, and the label carries a ⚠ warning about buying against the trend. This now uses the **same regime definition as the normal BUY signals** (confirmed Stage-4 decline), so the two systems always agree on what "bearish regime" means.
- **Require RSI < 50** (off by default) — a Stoch-driven signal also needs RSI below 50, filtering oversolds that fire while RSI is still strong. Exception: an outright RSI-oversold reading always fires regardless.
- **Require Stoch Cross Up** (off by default) — waits for the Stoch RSI K line to cross up over D (momentum already turning) before showing. Fixed so it now delays the signal to the cross bar instead of removing it.
- **Require HTF Rising** (off by default) — only fires when the higher timeframe is rising off its recent low, measured **from the pivot** (its lowest recent value) rather than a fixed bar back, so a fresh turn isn't distorted by the prior decline. Includes an adjustable **HTF Low Lookback** window.
- **Require Prior Drop** (on by default) — the key quality filter: price must have actually **fallen** into the setup. The drop from the highest high of the last N bars down to the current low, measured in **ATR**, must exceed a threshold (default 4 ATR). This stops Golden Buys firing on oversold noise inside a sideways range — the signal now needs a real decline to reverse. Adjustable **Drop Lookback** and **Min Drop (ATR)**.
- **Wait for Bar Close** (off by default) — by default the label can appear on the forming candle as an early heads-up (it may repaint on the live bar); turn this on to only show confirmed, closed-bar signals.
**Under the hood:** the label repaints only on the live bar for early warning, while all trade state (SL/TP levels, anti-cluster tracking) commits strictly on bar close. Stop-loss and take-profit levels are drawn automatically for every Golden Buy using the shared risk engine, and now correctly replace any prior trade's levels.
---
## 🧹 Removed: Market Regime Filter, Exhaustion & Continuation paths
Three legacy systems were retired to keep the indicator focused (and to make room within Pine's compile limits):
- The **Market Regime Filter** has been removed — the Stage classifier and Path Fork already carry regime context.
- The Golden Buy's old **Exhaustion** (capitulation-drop) and **Continuation** paths are gone, superseded by the new multi-timeframe design above.
These simplifications also freed significant headroom, letting the new filters fit without cutting anything that matters.
---
## 📏 Fibonacci — re-anchored to a configurable lookback
The Fibonacci retracement no longer sticks to an old confirmed pivot. It now anchors to the **highest high and lowest low within a lookback window you set**, so it follows recent price action instead of lagging behind. On a sharp move, it re-anchors immediately rather than staying pinned to a stale swing.
- New **Pivot Lookback (bars)** input (default 50) controls how far back it searches for the anchor high/low.
---
## 🔱 Path Fork — now responds to oscillator exhaustion
Previously the projected path could continue climbing vertically even with RSI and Stoch pinned at the top. The Path Fork now factors **oscillator exhaustion** into both the drawn projection *and* the Bull/Bear percentages:
- When RSI and Stoch are stretched, a counter-force flattens or bends the projection toward mean reversion instead of extrapolating the move.
- The same exhaustion signal shifts the **Bull/Bear split** — so the panel and the projection stay consistent (previously the path could flatten while the panel still read strongly bullish).
- The effect scales with how stretched the oscillators are, and only acts near the extremes — healthy trends are left alone.
Both the projection and the probabilities read from a **single exhaustion source**, so they can never drift out of sync.
---
## 📊 Divergences — immediate detection
Divergence labels previously appeared several bars late, because pivot confirmation required bars to the right — often too late to act on. The divergence label engine has been rebuilt for **near-immediate detection**:
- Uses a **short pivot confirmation** so labels appear right after a swing, not five bars later.
- New **Label Confirmation (bars)** input (default 1) lets you tune how quickly labels draw — lower is faster (with more live-bar repaint), higher is steadier.
- Detection compares each new pivot with the previous one held in memory, drawing the line between the two real pivots.
The **Path Fork keeps its own confirmed-pivot divergence** for stable probabilities — the two serve different purposes: fast labels for you to react to, stable pivots for the projection math.
---
## Notes
- This build stays within Pine Script's compile limits; several internal routines were consolidated with no change to behaviour.
- The base V2.0.7 engine (BUY/SELL signals, confluence, ATR bands, MTF table, alerts) is unchanged.
- Signals confirm on bar close by design (anti-repaint), except where an early-warning option is explicitly offered and enabled.
A focused refinement of how the Path Fork reads price extremes, plus a matching fix to the written analysis.
📉 SMARTER PRICE-LOCATION READING (sub-hourly) On sub-hourly timeframes, where no trend is confirmed, the forecast now treats price extremes as mean-reverting rather than trend-following. Price stretched near the recent highs of its range now adds downside probability to the Path Fork, and price near the recent lows adds upside probability — reflecting the tendency of a range to snap back from its edges. This feeds directly into the bull/bear probability math, not just the wording.
On confirmed trends (higher timeframes, Stage 2 up / Stage 4 down) the trend-following read is unchanged, so the model never fights an established trend.
🩹 COHERENCE FIX The Technical Analysis panel and the Path Fork case breakdown now describe price location consistently with the probability it produces — near-lows correctly reads as a potential bounce, near-highs as a potential pull-back — and the wording follows the actual price position rather than an inferred one.
✂️ TIGHTER ANALYSIS TEXT The Technical Analysis narrative has been rewritten in a more concise, scannable style — the same information, fewer words.
نص برمجي للمستخدمين المدعوين فقط
يمكن فقط للمستخدمين المعتمدين من قبل المؤلف الوصول إلى هذا النص البرمجي. ستحتاج إلى طلب الإذن والحصول عليه لاستخدامه. يتم منح ذلك عادةً بعد الدفع. لمزيد من التفاصيل، اتبع تعليمات المؤلف أدناه أو تواصل مع Pedro-Elias مباشرةً.
لا توصي TradingView بالدفع مقابل برنامج نصي أو استخدامه إلا إذا كنت تثق تمامًا في مؤلفه وتفهم كيفية عمله. يمكنك أيضًا العثور على بدائل مجانية ومفتوحة المصدر في نصوص مجتمعنا.
تعليمات المؤلف

إخلاء المسؤولية
نص برمجي للمستخدمين المدعوين فقط
يمكن فقط للمستخدمين المعتمدين من قبل المؤلف الوصول إلى هذا النص البرمجي. ستحتاج إلى طلب الإذن والحصول عليه لاستخدامه. يتم منح ذلك عادةً بعد الدفع. لمزيد من التفاصيل، اتبع تعليمات المؤلف أدناه أو تواصل مع Pedro-Elias مباشرةً.
لا توصي TradingView بالدفع مقابل برنامج نصي أو استخدامه إلا إذا كنت تثق تمامًا في مؤلفه وتفهم كيفية عمله. يمكنك أيضًا العثور على بدائل مجانية ومفتوحة المصدر في نصوص مجتمعنا.