PROTECTED SOURCE SCRIPT
Adaptive MACD Divergences
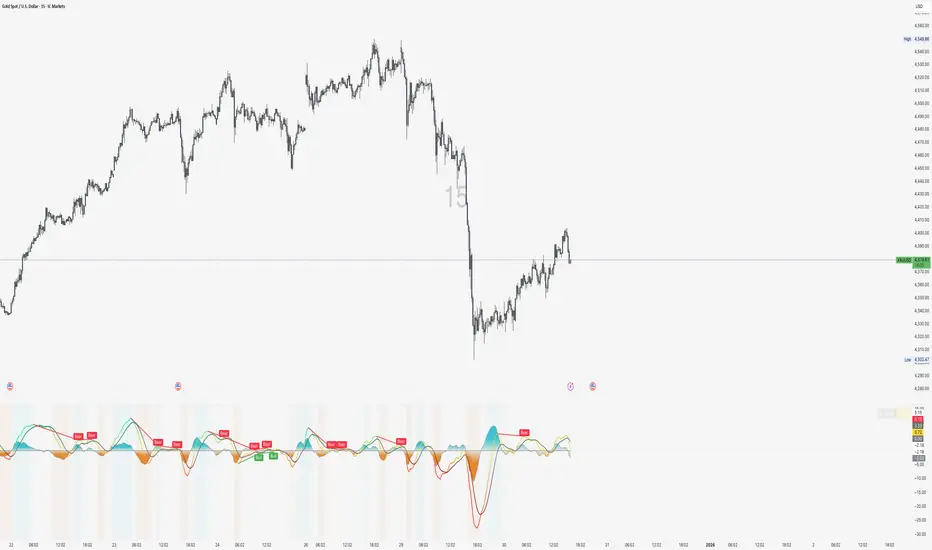
Overview
The Adaptive MACD Divergences Indicator is an advanced technical analysis tool that combines traditional MACD analysis with revolutionary R-squared (R²) correlation-based adaptation and sophisticated divergence detection. Unlike standard MACD indicators, this system automatically adjusts its sensitivity based on market conditions, providing cleaner signals in ranging markets and faster responses during strong trends.
Key Features
1. R² Adaptive Technology
Automatically measures market trend strength using R-squared correlation
Self-adjusts between responsive (trending) and smooth (choppy) modes
Reduces false signals without manual parameter changes
2. Enhanced Visual System
Gradient color-coded lines showing momentum strength at a glance
Beautiful shadow histogram with depth effects
Real-time R² value display showing adaptation strength
3. Advanced Divergence Detection
Four types of divergences (Regular/Hidden, Bullish/Bearish)
Multi-pivot scanning for catching all valid divergences
Sophisticated filtering to reduce false signals
4. Professional Grade Features
Customizable alert conditions for automated trading
Extensive parameter control with detailed tooltips
Works on all timeframes and instruments
How the Adaptive R² System Works
Understanding R-Squared (R²)
R² measures how well price follows a linear trend, ranging from 0 to 1:
R² = 0.8-1.0: Strong linear trend → MACD becomes MORE responsive
R² = 0.3-0.7: Moderate trend → Balanced MACD behavior
R² = 0.0-0.3: No trend/choppy → MACD becomes SMOOTHER
Adaptation Benefits
In Trending Markets: Catches moves early, stays with trends longer
In Ranging Markets: Filters out noise, reduces whipsaws
During Transitions: Automatically adjusts as market changes
The indicator displays the current R² value with color coding:
🟢 Green: Strong trend detected (R² > 0.7)
🟡 Yellow: Moderate trend (R² 0.3-0.7)
🔴 Red: Choppy/ranging market (R² < 0.3)
Input Parameters Explained
MACD Calculation Method
📊 Use Adaptive R² Mode
ON (Default): Enables intelligent market adaptation
OFF: Uses traditional fixed MACD calculation
When to use each:
Adaptive: Most market conditions, especially mixed trending/ranging
Standard: When you need consistent behavior regardless of market state
Adaptive Settings
R² Correlation Period (Default: 20)
Controls how many bars are analyzed to determine trend strength
5-15 bars: Quick adaptation, good for scalping
20-30 bars: Balanced for day trading
40+ bars: Smooth adaptation for position trading
Show R² Value Table
Displays real-time adaptation strength
Helps understand when indicator is most/least responsive
MACD Parameters
Fast EMA Period (Default: 12)
The quick-responding component
Lower (8-10): More sensitive, more signals
Higher (14-16): Smoother, fewer false signals
Slow EMA Period (Default: 26)
The trend-following component
Lower (20-24): More responsive to changes
Higher (28-35): Better trend filtration
Signal Line Smoothing (Default: 9)
Creates the trigger line for crossovers
Lower (5-7): Faster signals, more whipsaws
Higher (10-15): Delayed but more reliable signals
Price Source
Close: Standard, most accurate
HL2: (High+Low)/2, reduces noise
HLC3: Typical price, good balance
OHLC4: Most smoothing
Visual Settings
Shadow Intensity (Default: 0.4)
Controls histogram gradient strength
0.1-0.3: Subtle, clean appearance
0.4-0.6: Balanced visibility
0.7-1.0: Bold, high contrast
Gradient Lookback (Default: 100)
Determines color intensity scaling
20-50: Colors change frequently
100: Balanced color distribution
150-200: Stable colors
Divergence Detection
Divergence Types
🟢 Regular Bullish: Reversal signal at bottoms
🔴 Regular Bearish: Reversal signal at tops
🟢 Hidden Bullish: Trend continuation in uptrends
🔴 Hidden Bearish: Trend continuation in downtrends
Zero Line Filter (Default: ON)
When enabled, divergences must respect the zero line
Filters out weaker, less reliable divergences
Pivot Lookback Left/Right (Default: 5/5)
Determines pivot point significance
Lower (2-4): More pivots detected, more signals
Higher (6-10): Only major pivots, stronger signals
Minimum Pivot Distance (Default: 2)
Prevents duplicate signals from nearby pivots
1-2: Maximum sensitivity
3-5: Clean, distinct signals
6+: Only widely spaced divergences
Lookback Range (Min: 5, Max: 60)
How far back to search for divergence patterns
Narrow (5-20): Recent divergences only
Wide (40-60): Can find older developing patterns
Pivots to Scan (Default: 5)
How many previous pivots to check
Higher values catch more divergences but use more resources
Strict Zero Check (Default: OFF)
OFF: Quick validation using highest/lowest
ON: Bar-by-bar validation for highest quality signals
Trading Strategies
Strategy 1: Trend Following with R² Confirmation
Setup:
Use Adaptive Mode
Watch R² value for trend strength
Focus on MACD/Signal crossovers
Entry Rules:
Long: MACD crosses above Signal when R² > 0.5
Short: MACD crosses below Signal when R² > 0.5
Avoid: All signals when R² < 0.3 (choppy market)
Exit Rules:
When R² drops below 0.3 (trend weakening)
Opposite crossover signal
Fixed stop-loss at swing high/low
Best For: Trending markets, position trading
Strategy 2: Divergence Reversal Trading
Setup:
Enable Regular Divergences only
Use Zero Line Filter
Set Strict Zero Check for quality
Entry Rules:
Bullish: Enter long when Regular Bullish divergence appears
Confirm with price above recent swing low
MACD starting to curve upward
Bearish: Enter short when Regular Bearish divergence appears
Confirm with price below recent swing high
MACD starting to curve downward
Risk Management:
Stop-loss beyond the divergence pivot point
Target 2:1 risk/reward minimum
Reduce position if divergence pivot is violated
Best For: Range trading, catching reversals
Strategy 3: Momentum Continuation
Setup:
Enable Hidden Divergences
Use histogram color intensity
Monitor gradient line colors
Entry Rules:
Hidden Bullish: Add to longs in uptrends
Hidden Bearish: Add to shorts in downtrends
Confirm with histogram expanding in trade direction
Position Sizing:
Scale in when hidden divergences appear
Increase position when R² rises above 0.7
Reduce when histogram shows weakening (color fading)
Best For: Trending markets, pyramiding positions
Strategy 4: Multi-Timeframe Confluence
Setup:
Apply indicator on 3 timeframes (e.g., 1H, 4H, Daily)
Look for alignment across timeframes
Entry Rules:
Strong Signal: Divergence on higher timeframe + Crossover on lower
Confirmation: R² > 0.5 on at least 2 timeframes
Direction: All timeframes showing same histogram color bias
Management:
Use highest timeframe for overall direction
Middle timeframe for entry timing
Lowest timeframe for precise execution
Best For: Swing trading, high probability setups
Strategy 5: Adaptive Scalping
Setup:
Set R² Correlation Period to 10
Fast EMA to 8, Slow to 21, Signal to 5
Focus on histogram momentum changes
Entry Rules:
Enter when histogram changes from decreasing to increasing
Confirm with line color gradient brightening
R² must be above 0.4
Quick Exit Rules:
Exit when histogram peaks (color at maximum intensity)
Or when gradient color starts fading
Maximum hold time: 10-15 bars
Best For: Active traders, liquid markets
Risk Management Guidelines
Position Sizing
High R² (>0.7): Can use standard position size
Medium R² (0.3-0.7): Reduce to 75% size
Low R² (<0.3): Reduce to 50% or avoid
Stop-Loss Placement
Regular Divergences: Beyond the pivot point
Hidden Divergences: Previous swing high/low
Crossover Trades: Below/above recent support/resistance
Trade Filtering
Avoid signals when R² is unstable (rapidly changing)
Skip divergences that barely meet minimum requirements
Don't trade against strong histogram momentum
Market Condition Guidelines
Best Market Conditions
Trending Markets: R² > 0.5, clear directional movement
Reversal Points: Multiple divergences converging
Breakout Setups: R² rising from low to high values
Avoid Trading When
R² remains below 0.3 for extended periods
Histogram repeatedly crosses zero without follow-through
Divergences appear in both directions simultaneously
Alert Setup
The indicator provides four alert conditions:
Regular Bullish Divergence: Major bottom reversal signal
Regular Bearish Divergence: Major top reversal signal
Hidden Bullish Divergence: Uptrend continuation signal
Hidden Bearish Divergence: Downtrend continuation signal
Alert Best Practices
Combine with price alerts at key levels
Use different alert sounds for different divergence types
Set alerts on higher timeframes to reduce noise
Optimization Tips
For Different Market Types
Trending Markets:
Increase R² Correlation Period (25-30)
Standard MACD settings work well
Focus on Hidden Divergences
Ranging Markets:
Decrease R² Correlation Period (15-20)
Increase Signal smoothing (12-15)
Focus on Regular Divergences with strict filtering
Volatile Markets:
Enable Strict Zero Check
Increase Minimum Pivot Distance (3-4)
Use higher Pivot Lookback values (6-7)
For Different Trading Styles
Day Trading:
R² Period: 15-20
Fast EMA: 8-10
Enable all divergence types
Swing Trading:
R² Period: 25-30
Standard MACD settings
Focus on Regular Divergences
Position Trading:
R² Period: 40-50
Slow EMA: 30-35
Only major divergences (increase pivot lookback)
Common Questions
Q: When should I use Adaptive vs Standard mode?
A: Use Adaptive for most situations. Only use Standard when you need consistent behavior for systematic trading or backtesting.
Q: Why are some divergences not detected?
A: Check your Zero Line Filter and Strict Zero Check settings. These filters improve quality but reduce quantity.
Q: What R² value is considered "good" for trading?
A: Above 0.5 indicates sufficient trend. Above 0.7 is strong. Below 0.3 suggests waiting for better conditions.
Q: Can this indicator be the sole basis for trading decisions?
A: No indicator should be used in isolation. Combine with price action, support/resistance, and overall market context.
Conclusion
The Adaptive MACD Divergences Indicator represents a significant evolution in MACD technology. By combining correlation-based adaptation with sophisticated divergence detection and professional visualization, it provides traders with a powerful tool that automatically adjusts to changing market conditions. The key to success is understanding when the indicator is most effective (R² feedback) and combining it with sound risk management principles.
The Adaptive MACD Divergences Indicator is an advanced technical analysis tool that combines traditional MACD analysis with revolutionary R-squared (R²) correlation-based adaptation and sophisticated divergence detection. Unlike standard MACD indicators, this system automatically adjusts its sensitivity based on market conditions, providing cleaner signals in ranging markets and faster responses during strong trends.
Key Features
1. R² Adaptive Technology
Automatically measures market trend strength using R-squared correlation
Self-adjusts between responsive (trending) and smooth (choppy) modes
Reduces false signals without manual parameter changes
2. Enhanced Visual System
Gradient color-coded lines showing momentum strength at a glance
Beautiful shadow histogram with depth effects
Real-time R² value display showing adaptation strength
3. Advanced Divergence Detection
Four types of divergences (Regular/Hidden, Bullish/Bearish)
Multi-pivot scanning for catching all valid divergences
Sophisticated filtering to reduce false signals
4. Professional Grade Features
Customizable alert conditions for automated trading
Extensive parameter control with detailed tooltips
Works on all timeframes and instruments
How the Adaptive R² System Works
Understanding R-Squared (R²)
R² measures how well price follows a linear trend, ranging from 0 to 1:
R² = 0.8-1.0: Strong linear trend → MACD becomes MORE responsive
R² = 0.3-0.7: Moderate trend → Balanced MACD behavior
R² = 0.0-0.3: No trend/choppy → MACD becomes SMOOTHER
Adaptation Benefits
In Trending Markets: Catches moves early, stays with trends longer
In Ranging Markets: Filters out noise, reduces whipsaws
During Transitions: Automatically adjusts as market changes
The indicator displays the current R² value with color coding:
🟢 Green: Strong trend detected (R² > 0.7)
🟡 Yellow: Moderate trend (R² 0.3-0.7)
🔴 Red: Choppy/ranging market (R² < 0.3)
Input Parameters Explained
MACD Calculation Method
📊 Use Adaptive R² Mode
ON (Default): Enables intelligent market adaptation
OFF: Uses traditional fixed MACD calculation
When to use each:
Adaptive: Most market conditions, especially mixed trending/ranging
Standard: When you need consistent behavior regardless of market state
Adaptive Settings
R² Correlation Period (Default: 20)
Controls how many bars are analyzed to determine trend strength
5-15 bars: Quick adaptation, good for scalping
20-30 bars: Balanced for day trading
40+ bars: Smooth adaptation for position trading
Show R² Value Table
Displays real-time adaptation strength
Helps understand when indicator is most/least responsive
MACD Parameters
Fast EMA Period (Default: 12)
The quick-responding component
Lower (8-10): More sensitive, more signals
Higher (14-16): Smoother, fewer false signals
Slow EMA Period (Default: 26)
The trend-following component
Lower (20-24): More responsive to changes
Higher (28-35): Better trend filtration
Signal Line Smoothing (Default: 9)
Creates the trigger line for crossovers
Lower (5-7): Faster signals, more whipsaws
Higher (10-15): Delayed but more reliable signals
Price Source
Close: Standard, most accurate
HL2: (High+Low)/2, reduces noise
HLC3: Typical price, good balance
OHLC4: Most smoothing
Visual Settings
Shadow Intensity (Default: 0.4)
Controls histogram gradient strength
0.1-0.3: Subtle, clean appearance
0.4-0.6: Balanced visibility
0.7-1.0: Bold, high contrast
Gradient Lookback (Default: 100)
Determines color intensity scaling
20-50: Colors change frequently
100: Balanced color distribution
150-200: Stable colors
Divergence Detection
Divergence Types
🟢 Regular Bullish: Reversal signal at bottoms
🔴 Regular Bearish: Reversal signal at tops
🟢 Hidden Bullish: Trend continuation in uptrends
🔴 Hidden Bearish: Trend continuation in downtrends
Zero Line Filter (Default: ON)
When enabled, divergences must respect the zero line
Filters out weaker, less reliable divergences
Pivot Lookback Left/Right (Default: 5/5)
Determines pivot point significance
Lower (2-4): More pivots detected, more signals
Higher (6-10): Only major pivots, stronger signals
Minimum Pivot Distance (Default: 2)
Prevents duplicate signals from nearby pivots
1-2: Maximum sensitivity
3-5: Clean, distinct signals
6+: Only widely spaced divergences
Lookback Range (Min: 5, Max: 60)
How far back to search for divergence patterns
Narrow (5-20): Recent divergences only
Wide (40-60): Can find older developing patterns
Pivots to Scan (Default: 5)
How many previous pivots to check
Higher values catch more divergences but use more resources
Strict Zero Check (Default: OFF)
OFF: Quick validation using highest/lowest
ON: Bar-by-bar validation for highest quality signals
Trading Strategies
Strategy 1: Trend Following with R² Confirmation
Setup:
Use Adaptive Mode
Watch R² value for trend strength
Focus on MACD/Signal crossovers
Entry Rules:
Long: MACD crosses above Signal when R² > 0.5
Short: MACD crosses below Signal when R² > 0.5
Avoid: All signals when R² < 0.3 (choppy market)
Exit Rules:
When R² drops below 0.3 (trend weakening)
Opposite crossover signal
Fixed stop-loss at swing high/low
Best For: Trending markets, position trading
Strategy 2: Divergence Reversal Trading
Setup:
Enable Regular Divergences only
Use Zero Line Filter
Set Strict Zero Check for quality
Entry Rules:
Bullish: Enter long when Regular Bullish divergence appears
Confirm with price above recent swing low
MACD starting to curve upward
Bearish: Enter short when Regular Bearish divergence appears
Confirm with price below recent swing high
MACD starting to curve downward
Risk Management:
Stop-loss beyond the divergence pivot point
Target 2:1 risk/reward minimum
Reduce position if divergence pivot is violated
Best For: Range trading, catching reversals
Strategy 3: Momentum Continuation
Setup:
Enable Hidden Divergences
Use histogram color intensity
Monitor gradient line colors
Entry Rules:
Hidden Bullish: Add to longs in uptrends
Hidden Bearish: Add to shorts in downtrends
Confirm with histogram expanding in trade direction
Position Sizing:
Scale in when hidden divergences appear
Increase position when R² rises above 0.7
Reduce when histogram shows weakening (color fading)
Best For: Trending markets, pyramiding positions
Strategy 4: Multi-Timeframe Confluence
Setup:
Apply indicator on 3 timeframes (e.g., 1H, 4H, Daily)
Look for alignment across timeframes
Entry Rules:
Strong Signal: Divergence on higher timeframe + Crossover on lower
Confirmation: R² > 0.5 on at least 2 timeframes
Direction: All timeframes showing same histogram color bias
Management:
Use highest timeframe for overall direction
Middle timeframe for entry timing
Lowest timeframe for precise execution
Best For: Swing trading, high probability setups
Strategy 5: Adaptive Scalping
Setup:
Set R² Correlation Period to 10
Fast EMA to 8, Slow to 21, Signal to 5
Focus on histogram momentum changes
Entry Rules:
Enter when histogram changes from decreasing to increasing
Confirm with line color gradient brightening
R² must be above 0.4
Quick Exit Rules:
Exit when histogram peaks (color at maximum intensity)
Or when gradient color starts fading
Maximum hold time: 10-15 bars
Best For: Active traders, liquid markets
Risk Management Guidelines
Position Sizing
High R² (>0.7): Can use standard position size
Medium R² (0.3-0.7): Reduce to 75% size
Low R² (<0.3): Reduce to 50% or avoid
Stop-Loss Placement
Regular Divergences: Beyond the pivot point
Hidden Divergences: Previous swing high/low
Crossover Trades: Below/above recent support/resistance
Trade Filtering
Avoid signals when R² is unstable (rapidly changing)
Skip divergences that barely meet minimum requirements
Don't trade against strong histogram momentum
Market Condition Guidelines
Best Market Conditions
Trending Markets: R² > 0.5, clear directional movement
Reversal Points: Multiple divergences converging
Breakout Setups: R² rising from low to high values
Avoid Trading When
R² remains below 0.3 for extended periods
Histogram repeatedly crosses zero without follow-through
Divergences appear in both directions simultaneously
Alert Setup
The indicator provides four alert conditions:
Regular Bullish Divergence: Major bottom reversal signal
Regular Bearish Divergence: Major top reversal signal
Hidden Bullish Divergence: Uptrend continuation signal
Hidden Bearish Divergence: Downtrend continuation signal
Alert Best Practices
Combine with price alerts at key levels
Use different alert sounds for different divergence types
Set alerts on higher timeframes to reduce noise
Optimization Tips
For Different Market Types
Trending Markets:
Increase R² Correlation Period (25-30)
Standard MACD settings work well
Focus on Hidden Divergences
Ranging Markets:
Decrease R² Correlation Period (15-20)
Increase Signal smoothing (12-15)
Focus on Regular Divergences with strict filtering
Volatile Markets:
Enable Strict Zero Check
Increase Minimum Pivot Distance (3-4)
Use higher Pivot Lookback values (6-7)
For Different Trading Styles
Day Trading:
R² Period: 15-20
Fast EMA: 8-10
Enable all divergence types
Swing Trading:
R² Period: 25-30
Standard MACD settings
Focus on Regular Divergences
Position Trading:
R² Period: 40-50
Slow EMA: 30-35
Only major divergences (increase pivot lookback)
Common Questions
Q: When should I use Adaptive vs Standard mode?
A: Use Adaptive for most situations. Only use Standard when you need consistent behavior for systematic trading or backtesting.
Q: Why are some divergences not detected?
A: Check your Zero Line Filter and Strict Zero Check settings. These filters improve quality but reduce quantity.
Q: What R² value is considered "good" for trading?
A: Above 0.5 indicates sufficient trend. Above 0.7 is strong. Below 0.3 suggests waiting for better conditions.
Q: Can this indicator be the sole basis for trading decisions?
A: No indicator should be used in isolation. Combine with price action, support/resistance, and overall market context.
Conclusion
The Adaptive MACD Divergences Indicator represents a significant evolution in MACD technology. By combining correlation-based adaptation with sophisticated divergence detection and professional visualization, it provides traders with a powerful tool that automatically adjusts to changing market conditions. The key to success is understanding when the indicator is most effective (R² feedback) and combining it with sound risk management principles.
نص برمجي محمي
تم نشر هذا النص البرمجي كمصدر مغلق. ومع ذلك، يمكنك استخدامه بحرية ودون أي قيود - تعرف على المزيد هنا.

إخلاء المسؤولية
لا يُقصد بالمعلومات والمنشورات أن تكون، أو تشكل، أي نصيحة مالية أو استثمارية أو تجارية أو أنواع أخرى من النصائح أو التوصيات المقدمة أو المعتمدة من TradingView. اقرأ المزيد في شروط الاستخدام.
نص برمجي محمي
تم نشر هذا النص البرمجي كمصدر مغلق. ومع ذلك، يمكنك استخدامه بحرية ودون أي قيود - تعرف على المزيد هنا.
إخلاء المسؤولية
لا يُقصد بالمعلومات والمنشورات أن تكون، أو تشكل، أي نصيحة مالية أو استثمارية أو تجارية أو أنواع أخرى من النصائح أو التوصيات المقدمة أو المعتمدة من TradingView. اقرأ المزيد في شروط الاستخدام.