Quarterly Theory True Opens [TakingProphets]
OVERVIEW
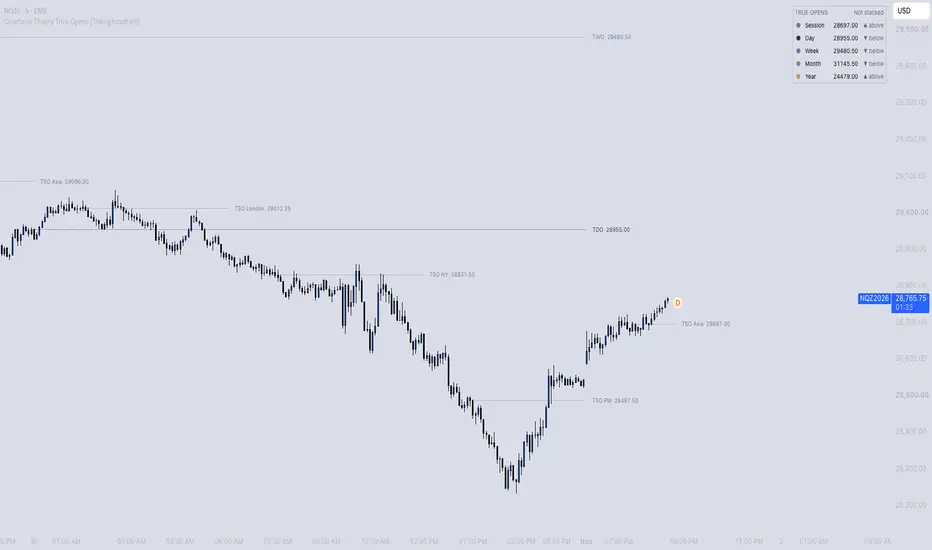
Quarterly Theory True Opens [TakingProphets] plots the True Open of every Quarterly Theory cycle, from the session up to the year, on one chart.
It is designed for analysts and educators studying how price is delivered around the opening price of each cycle's second quarter.
This indicator does not provide trading signals or forecasts.
All logic serves educational and analytical purposes only.
Quarterly Theory splits every time cycle into four quarters. The True Open is the open of the second quarter (Q2). It is a reference price: the first quarter often sets up the cycle, and the True Open is the level the rest of the cycle's movement is measured from. Price trading below a True Open is considered discount relative to that cycle, and price above it is considered premium.
The indicator tracks five cycles at once:
Session – each 6-hour session's True Open, at 19:30, 01:30, 07:30 and 13:30 New York time.
Day – the 00:00 open of the 18:00 to 18:00 trading day.
Week – the Monday 18:00 open.
Month – the Sunday 18:00 open before the month's second Monday.
Year – the open of the April 1 trading day.
-----------------------------------------------------------------------------------------------
PURPOSE AND SCOPE
-----------------------------------------------------------------------------------------------
The framework serves as a reference tool for studying price in relation to the True Open of several cycles at the same time.
It is commonly used to:
Mark the True Open of each cycle without manual drawing.
Study whether price is trading in the premium or discount of each cycle.
Observe when the True Opens of several cycles line up in the same order (a stacked alignment).
Review how price reacts at previous True Opens.
Receive alerts when price crosses a True Open.
-----------------------------------------------------------------------------------------------
LOGIC STRUCTURE
-----------------------------------------------------------------------------------------------
Trading Day:
All cycles use New York time. The trading day runs from 18:00 to 18:00, so the 18:00 open starts the next day.
Session True Open:
Each trading day has four 6-hour sessions starting 18:00, 00:00, 06:00 and 12:00. Each session is split into four 90-minute quarters, so its True Open is the open of the candle at 19:30 (Asia), 01:30 (London), 07:30 (New York) or 13:30 (PM).
Day True Open:
The four sessions are the quarters of the day. Q2 (London) starts at 00:00, so the True Day Open is the open of the 00:00 candle.
Week True Open:
Monday through Thursday are the quarters of the week, with Friday folded into the last quarter. Q2 is Tuesday's trading day, which begins Monday at 18:00.
Month True Open:
The month's full trading weeks are its quarters, and a partial first week is skipped. Q2 is the week of the second Monday (the Monday dated the 8th to the 14th), so the True Month Open is that week's Sunday 18:00 open.
Year True Open:
Calendar quarters are the quarters of the year. The True Year Open is the open of the first trading day of April.
Exact Opens:
Each True Open is read from a data stream whose candles begin exactly on that open's boundary. Session and day opens use the chart timeframe up to 30 minutes, and a 30-minute stream above that. Week and month opens use the daily stream, and the year open uses the monthly stream. The plotted price is the open of the real candle at that time on any chart timeframe.
Market Gaps:
A True Open only prints when its time falls inside the trading day being opened. After a weekend or holiday gap, the first candle does not print opens for clock times that passed while the market was closed.
Stacked True Opens:
Cycles are ordered from the session up to the year. When price is below the session open, the session open is below the day open, and so on, the opens form a discount stack. The mirror order above price forms a premium stack. The panel counts how many consecutive cycles stack in the same order, starting from the session.
-----------------------------------------------------------------------------------------------
COMPONENTS AND VISUALS
-----------------------------------------------------------------------------------------------
True Open Lines: One line per cycle, starting at the open's candle. The open in play ends just past the current candle; completed opens stop where their cycle ended.
Labels: Each line carries a label at its end with the cycle name (TSO, TDO, TWO, TMO, TYO, or the full name) and optionally the price. Opens that would overlap at the same price and time merge into one label, highest cycle first (for example "TDO + TSO London").
Previous Opens: The last few completed True Opens of each cycle can stay on the chart for review.
Stack Panel: A compact table listing each cycle's True Open price, whether price is above or below it, and the current stack (Premium stack, Discount stack, or Not stacked).
Timeframe Filtering: Opens that are too small for the chart timeframe can be hidden automatically.
-----------------------------------------------------------------------------------------------
INPUT CATEGORIES
-----------------------------------------------------------------------------------------------
General – Show previous opens, hide opens too small for the timeframe.
True Opens – Toggle and color for the session, day, week, month and year opens.
Stack Panel – Show, position and size.
Visual – Line style and thickness (Thin / Medium / Thick), labels with short or full names, label size, price in labels.
-----------------------------------------------------------------------------------------------
ALERT FRAMEWORK
-----------------------------------------------------------------------------------------------
When enabled, alerts may notify for:
Price crossing the True Session Open.
Price crossing the True Day Open.
Price crossing the True Week Open.
All alerts output plain text messages only and do not execute orders.
-----------------------------------------------------------------------------------------------
USAGE GUIDELINES
-----------------------------------------------------------------------------------------------
Quarterly Theory True Opens is suited for review and documentation of price around cycle opens.
Recommended educational workflows:
Start on a 5m or 15m chart to see the session, day and week opens together.
Use the panel to note which cycles price is trading above or below.
Journal how price behaves when several True Opens are stacked compared with when they are not.
Turn on previous opens to review reactions at earlier True Opens.
Teach Quarterly Theory cycles and quarters in mentorship or training contexts.
-----------------------------------------------------------------------------------------------
OPERATIONAL NOTES AND LIMITATIONS
-----------------------------------------------------------------------------------------------
All times are New York time with an 18:00 trading-day anchor.
Opens are fixed once their candle opens and never change afterwards. No look-ahead is used.
On very low timeframes, TradingView may not load enough higher-timeframe history for the year open; it shows on 15m and higher.
Session and day opens are timed for markets that trade around the clock, such as futures, forex and crypto. On markets with shorter sessions some opens may not exist.
Older drawings are removed automatically to stay within TradingView's object limits.
No strategy module or backtest engine is included.
-----------------------------------------------------------------------------------------------
ORIGINALITY
-----------------------------------------------------------------------------------------------
Quarterly Theory True Opens combines several parts into one tool:
A cycle engine that computes the True Open of five cycles from their Quarterly Theory definitions.
Exact-open sampling that reads each open from a stream aligned to its boundary, so the price matches the real candle on any timeframe.
Gap handling so weekends and holidays do not create false opens.
A stack counter that measures how many cycles line up in premium or discount.
Label merging that keeps overlapping opens readable.
The logic is entirely original, written in Pine Script v6.
-----------------------------------------------------------------------------------------------
ATTRIBUTION
-----------------------------------------------------------------------------------------------
Quarterly Theory, True Opens, and Premium and Discount are publicly taught concepts within ICT-style market education. This implementation was designed and engineered by TakingProphets.
-----------------------------------------------------------------------------------------------
TERMS AND DISCLAIMER
-----------------------------------------------------------------------------------------------
This indicator is for educational and informational use only. It does not provide financial advice or predictive output. Historical patterns do not guarantee future results. All users remain responsible for their own decisions. Use of this script implies agreement with TradingView's Terms of Use.
Quarterly Theory True Opens [TakingProphets] plots the True Open of every Quarterly Theory cycle, from the session up to the year, on one chart.
It is designed for analysts and educators studying how price is delivered around the opening price of each cycle's second quarter.
This indicator does not provide trading signals or forecasts.
All logic serves educational and analytical purposes only.
Quarterly Theory splits every time cycle into four quarters. The True Open is the open of the second quarter (Q2). It is a reference price: the first quarter often sets up the cycle, and the True Open is the level the rest of the cycle's movement is measured from. Price trading below a True Open is considered discount relative to that cycle, and price above it is considered premium.
The indicator tracks five cycles at once:
Session – each 6-hour session's True Open, at 19:30, 01:30, 07:30 and 13:30 New York time.
Day – the 00:00 open of the 18:00 to 18:00 trading day.
Week – the Monday 18:00 open.
Month – the Sunday 18:00 open before the month's second Monday.
Year – the open of the April 1 trading day.
-----------------------------------------------------------------------------------------------
PURPOSE AND SCOPE
-----------------------------------------------------------------------------------------------
The framework serves as a reference tool for studying price in relation to the True Open of several cycles at the same time.
It is commonly used to:
Mark the True Open of each cycle without manual drawing.
Study whether price is trading in the premium or discount of each cycle.
Observe when the True Opens of several cycles line up in the same order (a stacked alignment).
Review how price reacts at previous True Opens.
Receive alerts when price crosses a True Open.
-----------------------------------------------------------------------------------------------
LOGIC STRUCTURE
-----------------------------------------------------------------------------------------------
Trading Day:
All cycles use New York time. The trading day runs from 18:00 to 18:00, so the 18:00 open starts the next day.
Session True Open:
Each trading day has four 6-hour sessions starting 18:00, 00:00, 06:00 and 12:00. Each session is split into four 90-minute quarters, so its True Open is the open of the candle at 19:30 (Asia), 01:30 (London), 07:30 (New York) or 13:30 (PM).
Day True Open:
The four sessions are the quarters of the day. Q2 (London) starts at 00:00, so the True Day Open is the open of the 00:00 candle.
Week True Open:
Monday through Thursday are the quarters of the week, with Friday folded into the last quarter. Q2 is Tuesday's trading day, which begins Monday at 18:00.
Month True Open:
The month's full trading weeks are its quarters, and a partial first week is skipped. Q2 is the week of the second Monday (the Monday dated the 8th to the 14th), so the True Month Open is that week's Sunday 18:00 open.
Year True Open:
Calendar quarters are the quarters of the year. The True Year Open is the open of the first trading day of April.
Exact Opens:
Each True Open is read from a data stream whose candles begin exactly on that open's boundary. Session and day opens use the chart timeframe up to 30 minutes, and a 30-minute stream above that. Week and month opens use the daily stream, and the year open uses the monthly stream. The plotted price is the open of the real candle at that time on any chart timeframe.
Market Gaps:
A True Open only prints when its time falls inside the trading day being opened. After a weekend or holiday gap, the first candle does not print opens for clock times that passed while the market was closed.
Stacked True Opens:
Cycles are ordered from the session up to the year. When price is below the session open, the session open is below the day open, and so on, the opens form a discount stack. The mirror order above price forms a premium stack. The panel counts how many consecutive cycles stack in the same order, starting from the session.
-----------------------------------------------------------------------------------------------
COMPONENTS AND VISUALS
-----------------------------------------------------------------------------------------------
True Open Lines: One line per cycle, starting at the open's candle. The open in play ends just past the current candle; completed opens stop where their cycle ended.
Labels: Each line carries a label at its end with the cycle name (TSO, TDO, TWO, TMO, TYO, or the full name) and optionally the price. Opens that would overlap at the same price and time merge into one label, highest cycle first (for example "TDO + TSO London").
Previous Opens: The last few completed True Opens of each cycle can stay on the chart for review.
Stack Panel: A compact table listing each cycle's True Open price, whether price is above or below it, and the current stack (Premium stack, Discount stack, or Not stacked).
Timeframe Filtering: Opens that are too small for the chart timeframe can be hidden automatically.
-----------------------------------------------------------------------------------------------
INPUT CATEGORIES
-----------------------------------------------------------------------------------------------
General – Show previous opens, hide opens too small for the timeframe.
True Opens – Toggle and color for the session, day, week, month and year opens.
Stack Panel – Show, position and size.
Visual – Line style and thickness (Thin / Medium / Thick), labels with short or full names, label size, price in labels.
-----------------------------------------------------------------------------------------------
ALERT FRAMEWORK
-----------------------------------------------------------------------------------------------
When enabled, alerts may notify for:
Price crossing the True Session Open.
Price crossing the True Day Open.
Price crossing the True Week Open.
All alerts output plain text messages only and do not execute orders.
-----------------------------------------------------------------------------------------------
USAGE GUIDELINES
-----------------------------------------------------------------------------------------------
Quarterly Theory True Opens is suited for review and documentation of price around cycle opens.
Recommended educational workflows:
Start on a 5m or 15m chart to see the session, day and week opens together.
Use the panel to note which cycles price is trading above or below.
Journal how price behaves when several True Opens are stacked compared with when they are not.
Turn on previous opens to review reactions at earlier True Opens.
Teach Quarterly Theory cycles and quarters in mentorship or training contexts.
-----------------------------------------------------------------------------------------------
OPERATIONAL NOTES AND LIMITATIONS
-----------------------------------------------------------------------------------------------
All times are New York time with an 18:00 trading-day anchor.
Opens are fixed once their candle opens and never change afterwards. No look-ahead is used.
On very low timeframes, TradingView may not load enough higher-timeframe history for the year open; it shows on 15m and higher.
Session and day opens are timed for markets that trade around the clock, such as futures, forex and crypto. On markets with shorter sessions some opens may not exist.
Older drawings are removed automatically to stay within TradingView's object limits.
No strategy module or backtest engine is included.
-----------------------------------------------------------------------------------------------
ORIGINALITY
-----------------------------------------------------------------------------------------------
Quarterly Theory True Opens combines several parts into one tool:
A cycle engine that computes the True Open of five cycles from their Quarterly Theory definitions.
Exact-open sampling that reads each open from a stream aligned to its boundary, so the price matches the real candle on any timeframe.
Gap handling so weekends and holidays do not create false opens.
A stack counter that measures how many cycles line up in premium or discount.
Label merging that keeps overlapping opens readable.
The logic is entirely original, written in Pine Script v6.
-----------------------------------------------------------------------------------------------
ATTRIBUTION
-----------------------------------------------------------------------------------------------
Quarterly Theory, True Opens, and Premium and Discount are publicly taught concepts within ICT-style market education. This implementation was designed and engineered by TakingProphets.
-----------------------------------------------------------------------------------------------
TERMS AND DISCLAIMER
-----------------------------------------------------------------------------------------------
This indicator is for educational and informational use only. It does not provide financial advice or predictive output. Historical patterns do not guarantee future results. All users remain responsible for their own decisions. Use of this script implies agreement with TradingView's Terms of Use.

إخلاء المسؤولية
لا يُقصد بالمعلومات والمنشورات أن تكون، أو تشكل، أي نصيحة مالية أو استثمارية أو تجارية أو أنواع أخرى من النصائح أو التوصيات المقدمة أو المعتمدة من TradingView. اقرأ المزيد في شروط الاستخدام.
إخلاء المسؤولية
لا يُقصد بالمعلومات والمنشورات أن تكون، أو تشكل، أي نصيحة مالية أو استثمارية أو تجارية أو أنواع أخرى من النصائح أو التوصيات المقدمة أو المعتمدة من TradingView. اقرأ المزيد في شروط الاستخدام.