OPEN-SOURCE SCRIPT
تم تحديثه Gann Reversal Confluence
Why this works
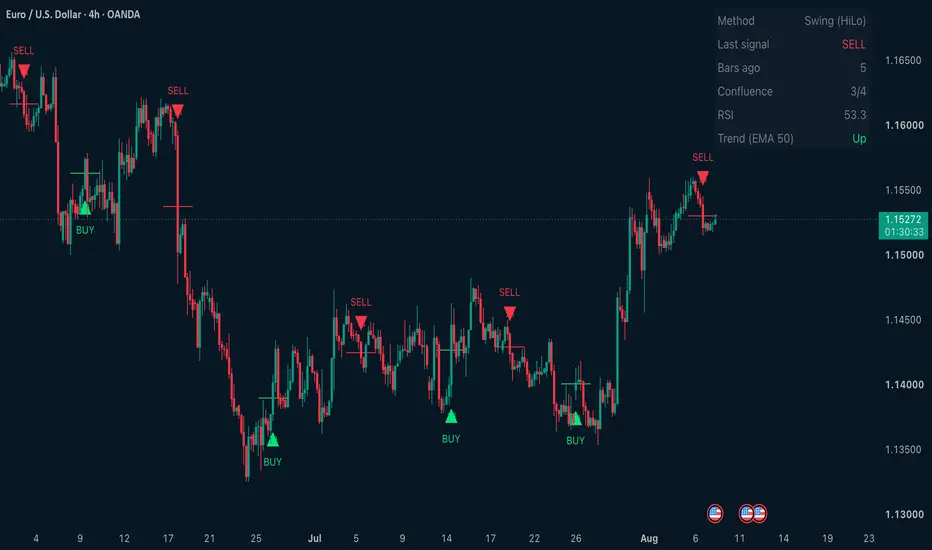
W.D. Gann never traded a reversal bar in isolation — a swing high/low break, key reversal, or outside bar was a trigger, not a signal on its own. He wanted it lining up with the bigger picture: was the move overextended, was volume backing it, was it a big enough bar to matter. Most free "Gann reversal" scripts on TradingView just plot the raw bar pattern and stop there — every swing break gets a triangle, whether it's a meaningful turn or noise. This indicator keeps the classic pattern detection but scores each one against the context Gann actually cared about, so you can see how much is lining up, not just that a shape appeared.
How this works
Pattern detection — pick one of three classic reversal triggers: Swing (price closes beyond the recent N-bar high/low), Key Reversal (new extreme that closes back through the prior close), or Outside Bar (engulfs the prior range and closes in the reversal direction).
Confluence scoring — every raw pattern is checked against up to five independent factors:
Range (ATR) — was the bar itself big enough to matter, or just noise?
Volume — did participation back the move?
Momentum (RSI) — was the market actually stretched, or was this a mid-range wiggle?
Trend (EMA) — is this a pullback with the trend, or a potential trend change against it? (shown, not scored against you)
Hour-ruler (optional, off by default) — a traditional Chaldean planetary-hour tag. Descriptive only, not a validated filter — treat it as a curiosity layered on top of the technical factors, not evidence on its own.
Cooldown — a minimum bar gap between signals stops the same swing from re-triggering repeatedly.
Everything commits on bar close only. Nothing here repaints or changes after the fact.
How to use it
Start with the defaults. Watch how the confluence score (shown next to each signal and in the status table) moves with the setups you'd have taken anyway.
Raise "Minimum confluence score to show signal" to hide everything below your conviction threshold — e.g. set it to 3 to only see signals where 3+ factors agree.
Use the level line each signal draws as a reference point for how price behaved on the next visit, not as a target.
This is a confluence aid, meant to sit alongside your own read of the chart and risk management — not a standalone entry/exit system.
Settings
Logic — reversal method, swing length, close vs. wick confirmation, minimum bars between signals.
Confluence — independently toggle ATR/Volume/RSI/Trend, tune each threshold, and set the minimum score required to show a signal.
Astro (optional) — off by default; enables the hour-ruler tag and lets you set a location for the sunrise/sunset calc it depends on.
Display — swing band, signal level lines, background highlight, confluence score label, status table (with position control), colors, and line styling.
Non-repainting. Every signal is final the moment it prints.
W.D. Gann never traded a reversal bar in isolation — a swing high/low break, key reversal, or outside bar was a trigger, not a signal on its own. He wanted it lining up with the bigger picture: was the move overextended, was volume backing it, was it a big enough bar to matter. Most free "Gann reversal" scripts on TradingView just plot the raw bar pattern and stop there — every swing break gets a triangle, whether it's a meaningful turn or noise. This indicator keeps the classic pattern detection but scores each one against the context Gann actually cared about, so you can see how much is lining up, not just that a shape appeared.
How this works
Pattern detection — pick one of three classic reversal triggers: Swing (price closes beyond the recent N-bar high/low), Key Reversal (new extreme that closes back through the prior close), or Outside Bar (engulfs the prior range and closes in the reversal direction).
Confluence scoring — every raw pattern is checked against up to five independent factors:
Range (ATR) — was the bar itself big enough to matter, or just noise?
Volume — did participation back the move?
Momentum (RSI) — was the market actually stretched, or was this a mid-range wiggle?
Trend (EMA) — is this a pullback with the trend, or a potential trend change against it? (shown, not scored against you)
Hour-ruler (optional, off by default) — a traditional Chaldean planetary-hour tag. Descriptive only, not a validated filter — treat it as a curiosity layered on top of the technical factors, not evidence on its own.
Cooldown — a minimum bar gap between signals stops the same swing from re-triggering repeatedly.
Everything commits on bar close only. Nothing here repaints or changes after the fact.
How to use it
Start with the defaults. Watch how the confluence score (shown next to each signal and in the status table) moves with the setups you'd have taken anyway.
Raise "Minimum confluence score to show signal" to hide everything below your conviction threshold — e.g. set it to 3 to only see signals where 3+ factors agree.
Use the level line each signal draws as a reference point for how price behaved on the next visit, not as a target.
This is a confluence aid, meant to sit alongside your own read of the chart and risk management — not a standalone entry/exit system.
Settings
Logic — reversal method, swing length, close vs. wick confirmation, minimum bars between signals.
Confluence — independently toggle ATR/Volume/RSI/Trend, tune each threshold, and set the minimum score required to show a signal.
Astro (optional) — off by default; enables the hour-ruler tag and lets you set a location for the sunrise/sunset calc it depends on.
Display — swing band, signal level lines, background highlight, confluence score label, status table (with position control), colors, and line styling.
Non-repainting. Every signal is final the moment it prints.
ملاحظات الأخبار
What's New — Gann Reversal Confluence Update(Update-only description — the original reversal-pattern description above stays as-is. This covers what was added.)
New: Confluence scoring (0–6)
Every reversal signal is now checked against up to six independent factors before it's shown, instead of displaying every raw pattern match.
Range significance (ATR) — the bar's high-low range must clear ATR multiplier × ATR. Filters out technically-matching bars too small to matter.
Volume confirmation — bar volume must exceed its rolling average by Volume multiplier. Auto-disables on symbols with no volume data so it never silently blocks signals it can't evaluate.
Momentum extreme (RSI) — bullish signals require RSI at/below oversold, bearish require RSI at/above overbought. Confirms the move was actually stretched.
Trend context (EMA) — a real directional gate: bullish only scores while price is above the trend EMA, bearish only while below. Trades with the higher-timeframe trend, not against it.
Hour-ruler tone (Chaldean, optional, off by default) — computes the current planetary hour's classical ruler from a solar-position calculation and your location. Bullish signals score a point only when the hour is ruled by Venus or Jupiter; bearish only when ruled by Mars or Saturn. Sun/Moon/Mercury hours are neutral and never contribute — kept narrow on purpose. Descriptive/traditional overlay, not a validated filter.
Day-ruler tone (Chaldean, optional, off by default) — same benefic/malefic logic applied to the weekday's own ruling planet. Independent of the hour ruler; the two can agree or disagree.
Each factor is toggleable individually. Minimum confluence score to show signal (dropdown, 0–6) sets how many factors must agree before a signal displays at all — it auto-caps at however many factors you actually have enabled, and the status HUD flags it with (capped) if you set it above that ceiling so it's never a silent "why did signals disappear" moment.
New: Status HUD
A compact table (configurable position and text size) showing the active method, last signal with bars-since, confluence score, RSI/trend reading, and — if the astro factors are on — the current hour and day ruler.
New: Backtest tools — and how to use them
Off by default, under its own Backtest tools group at the bottom of settings. Two modes, selected via Backtest display, plus a comparison table. These are tuning aids for evaluating your own settings — not a performance claim about the indicator.
Oscillator mode
Simulates the simplest possible system: enter on each raw signal, flip to the opposite side on the next opposite signal. No stop, no target, no fees. This is a relative comparison tool only — a trade can survive a huge intra-trade drawdown and still register as a win purely because price recovered by the time the next signal eventually printed. Use it to get a rough first read on whether raising the confluence filter helps at all, not to judge real performance.
PnL test mode
An actual risk-managed simulation: each trade gets an ATR-based stop (PnL test: stop) and target (PnL test: target), and exits on whichever comes first — stop, target, or a fresh opposite signal. Results report in R-multiples (1R = the stop distance) rather than raw percentages, since stop distance varies per trade with volatility. PnL test: risk % per trade converts total R into a rough, non-compounded equity estimate.
How to actually run a test
Set Backtest display to "PnL test" (or "Oscillator" for the quick/rough version).
Turn on Show breakdown table. This renders a table (bottom-right, independent size/on-off control) comparing every confluence threshold from 0 to 6 side by side — Trades, Win%, Avg result, Profit Factor, and Total result per row.
Read down the rows, not just at your current filter setting. Look for a threshold where Total result and Win% are both meaningfully better than threshold 0, and the trade count clears your Min trades to trust a threshold setting (default 20).
Buckets below that minimum are dimmed and marked with * in the table — a threshold with 8 trades can look great by pure luck. Don't set your live filter based on a starred row.
The single best-performing threshold that clears the minimum sample is highlighted so it's obvious at a glance.
Set Minimum confluence score to show signal (in the Confluence group) to whatever threshold the breakdown table supports, then turn the backtest tools back off — they're for tuning, not for leaving on.
Limitations to keep in mind while testing: no fees or slippage are modeled, it's a single-history simulation on whatever chart history is loaded (not walk-forward or out-of-sample), and a strong result on one symbol/timeframe is a starting point for further checking — not proof of an edge. Test across a few different symbols and timeframes before trusting any one result.
Non-repainting, as with everything else in this script: every signal and every backtest calculation is final the moment it confirms on bar close.
نص برمجي مفتوح المصدر
بروح TradingView الحقيقية، قام مبتكر هذا النص البرمجي بجعله مفتوح المصدر، بحيث يمكن للمتداولين مراجعة وظائفه والتحقق منها. شكرا للمؤلف! بينما يمكنك استخدامه مجانًا، تذكر أن إعادة نشر الكود يخضع لقواعد الموقع الخاصة بنا.

While the world trades price, we trade Time & Price.
Access our proprietary Indicator Suite: pivotzilla.com
Access our proprietary Indicator Suite: pivotzilla.com
إخلاء المسؤولية
لا يُقصد بالمعلومات والمنشورات أن تكون، أو تشكل، أي نصيحة مالية أو استثمارية أو تجارية أو أنواع أخرى من النصائح أو التوصيات المقدمة أو المعتمدة من TradingView. اقرأ المزيد في شروط الاستخدام.
نص برمجي مفتوح المصدر
بروح TradingView الحقيقية، قام مبتكر هذا النص البرمجي بجعله مفتوح المصدر، بحيث يمكن للمتداولين مراجعة وظائفه والتحقق منها. شكرا للمؤلف! بينما يمكنك استخدامه مجانًا، تذكر أن إعادة نشر الكود يخضع لقواعد الموقع الخاصة بنا.
While the world trades price, we trade Time & Price.
Access our proprietary Indicator Suite: pivotzilla.com
Access our proprietary Indicator Suite: pivotzilla.com
إخلاء المسؤولية
لا يُقصد بالمعلومات والمنشورات أن تكون، أو تشكل، أي نصيحة مالية أو استثمارية أو تجارية أو أنواع أخرى من النصائح أو التوصيات المقدمة أو المعتمدة من TradingView. اقرأ المزيد في شروط الاستخدام.