تم تحديثه
[blackcat] L3 Fibonacci Bands With ATR
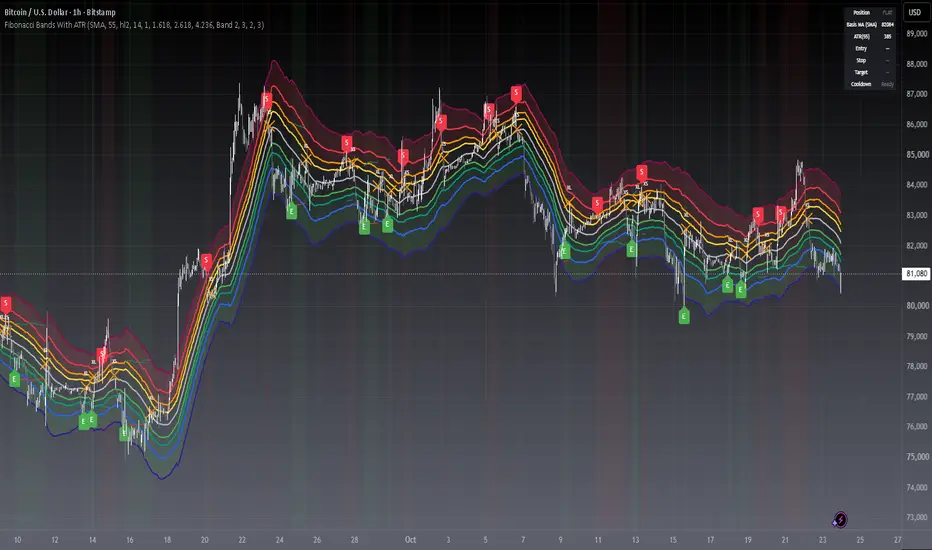
Today, what I'm going to introduce is a technical indicator that I think is quite in line with the indicator displayed by Tang - Fibonacci Bands with ATR. This indicator combines Bollinger Bands and Average True Range (ATR) to provide insights into market volatility and potential price reversals. Sounds complicated, right? Don't worry, I will explain it to you in the simplest way.
First, let's take a look at how Fibonacci Bands are constructed. They are similar to Bollinger Bands and consist of three lines: upper band, middle band (usually a 20-period simple moving average), and lower band. The difference is that Fibonacci Bands use ATR to calculate the distance between the upper and lower bands and the middle band.
Next is a key factor - ATR multiplier. We need to smooth the ATR using Welles Wilder's method. Then, by multiplying the ATR by a Fibonacci multiplier (e.g., 1.618), we get the upper band, called the upper Fibonacci channel. Similarly, multiplying the ATR by another Fibonacci multiplier (e.g., 0.618 or 1.0) gives us the lower band, called the lower Fibonacci channel.
Now, let's see how Fibonacci Bands can help us assess market volatility. When the channel widens, it means that market volatility is high, while a narrow channel indicates low market volatility. This way, we can determine the market's activity level based on the width of the channel.
In addition, when the price touches or crosses the Fibonacci channel, it may indicate a potential price reversal, similar to Bollinger Bands. Therefore, using Fibonacci Bands in trading can help us capture potential buy or sell signals.
In summary, Fibonacci Bands with ATR is an interesting and practical technical indicator that provides information about market volatility and potential price reversals by combining Bollinger Bands and ATR. Remember, make good use of these indicators and apply them flexibly in trading!
This code is a TradingView indicator script used to plot L3 Fibonacci Bands With ATR.
First, the indicator function is used to define the title and short title of the indicator, and whether it should be overlaid on the main chart.
Then, the input function is used to define three input parameters: MA type (maType), MA length (maLength), and data source (src). There are four options for MA type: SMA, EMA, WMA, and HMA. The default values are SMA, 55, and hl2 respectively.
Next, the moving average line is calculated based on the user's selected MA type. If maType is 'SMA', the ta.sma function is called to calculate the simple moving average; if maType is 'EMA', the ta.ema function is called to calculate the exponential moving average; if maType is 'WMA', the ta.wma function is called to calculate the weighted moving average; if maType is 'HMA', the ta.hma function is called to calculate the Hull moving average. The result is then assigned to the variable ma.
Then, the _atr variable is used to calculate the ATR (Average True Range) value using ta.atr, and multiplied by different coefficients to obtain four Fibonacci bias values: fibo_bias4, fibo_bias3, fibo_bias2, and fibo_bias1.
Finally, the prices of the upper and lower four Fibonacci bands are calculated by adding or subtracting the corresponding Fibonacci bias values from the current price, and plotted on the chart using the plot function.
First, let's take a look at how Fibonacci Bands are constructed. They are similar to Bollinger Bands and consist of three lines: upper band, middle band (usually a 20-period simple moving average), and lower band. The difference is that Fibonacci Bands use ATR to calculate the distance between the upper and lower bands and the middle band.
Next is a key factor - ATR multiplier. We need to smooth the ATR using Welles Wilder's method. Then, by multiplying the ATR by a Fibonacci multiplier (e.g., 1.618), we get the upper band, called the upper Fibonacci channel. Similarly, multiplying the ATR by another Fibonacci multiplier (e.g., 0.618 or 1.0) gives us the lower band, called the lower Fibonacci channel.
Now, let's see how Fibonacci Bands can help us assess market volatility. When the channel widens, it means that market volatility is high, while a narrow channel indicates low market volatility. This way, we can determine the market's activity level based on the width of the channel.
In addition, when the price touches or crosses the Fibonacci channel, it may indicate a potential price reversal, similar to Bollinger Bands. Therefore, using Fibonacci Bands in trading can help us capture potential buy or sell signals.
In summary, Fibonacci Bands with ATR is an interesting and practical technical indicator that provides information about market volatility and potential price reversals by combining Bollinger Bands and ATR. Remember, make good use of these indicators and apply them flexibly in trading!
This code is a TradingView indicator script used to plot L3 Fibonacci Bands With ATR.
First, the indicator function is used to define the title and short title of the indicator, and whether it should be overlaid on the main chart.
Then, the input function is used to define three input parameters: MA type (maType), MA length (maLength), and data source (src). There are four options for MA type: SMA, EMA, WMA, and HMA. The default values are SMA, 55, and hl2 respectively.
Next, the moving average line is calculated based on the user's selected MA type. If maType is 'SMA', the ta.sma function is called to calculate the simple moving average; if maType is 'EMA', the ta.ema function is called to calculate the exponential moving average; if maType is 'WMA', the ta.wma function is called to calculate the weighted moving average; if maType is 'HMA', the ta.hma function is called to calculate the Hull moving average. The result is then assigned to the variable ma.
Then, the _atr variable is used to calculate the ATR (Average True Range) value using ta.atr, and multiplied by different coefficients to obtain four Fibonacci bias values: fibo_bias4, fibo_bias3, fibo_bias2, and fibo_bias1.
Finally, the prices of the upper and lower four Fibonacci bands are calculated by adding or subtracting the corresponding Fibonacci bias values from the current price, and plotted on the chart using the plot function.
ملاحظات الأخبار
█ OVERVIEWAdaptive volatility channel built from a moving average and ATR-scaled Fibonacci multiples (1.0, 1.618, 2.618, 4.236). V2 adds mean-reversion signals with entry/exit logic, ATR-based stop/target reference levels, alerts, zone fills and a live dashboard — the original band engine is fully preserved.
█ CONCEPTS
The indicator projects four band pairs around a configurable moving average (SMA, EMA, WMA or HMA), each offset by ATR × a Fibonacci multiple. Outer bands mark statistically stretched price; the basis MA represents fair value.
Key principles:
• Volatility scaling — band width breathes with ATR, so the channel adapts across symbols and regimes
• Mean reversion — entries trigger when price closes back inside a selected band after an excursion beyond it
• Mean target — open positions aim for the basis MA; when price reverts to it, the trade is closed
• Signal governance — a position state machine with same-bar entry/exit exclusivity and a configurable cooldown filters churn
█ HOW TO USE
1 — Add the script to your chart; defaults replicate the classic SMA(55) / hl2 / ATR-follows-MA configuration
2 — Pick the Entry Band Level: Band 1 reacts fast, Bands 3-4 only fire on major exhaustion moves
3 — Read signals: E = long entry, S = short entry, XL/XS = exit at the basis MA
4 — Optional: enable TP/SL reference levels and create alerts from the four alert conditions
Input Parameters
• Bands Engine: MA type, MA length, price source, ATR length mode, and the four band multipliers (defaults keep the classic 1.0 / 1.618 / 2.618 / 4.236 spacing)
• Signals: master switch, long/short toggles, entry band level, exclusivity and cooldown bars
• Risk: TP/SL display toggle with ATR multipliers
• Visuals: basis MA, zone fills, labels, position background, dashboard
█ FEATURES
• Four ATR-scaled Fibonacci band pairs around an SMA/EMA/WMA/HMA basis
• Bidirectional mean-reversion signals with state machine, same-bar exclusivity and cooldown governance
• ATR-based stop-loss / take-profit reference lines per tracked position
• Gradient zone fills, position background tint and a live dashboard (position, basis, ATR, entry, stop, target, cooldown)
• Four alertcondition hooks plus dynamic bar-close alerts
█ SIGNALS
Visual Elements
• E label (green, below bar): long entry — close crossed back above the selected lower band
• S label (red, above bar): short entry — close crossed back under the selected upper band
• XL / XS cross (orange): exit — price reverted to the basis MA
• Green / red chart background: current long / short state
• Stop Loss / Take Profit broken lines: protective reference levels while a position is tracked
█ IMPLEMENTATION NOTES
• Built with ta.sma / ta.ema / ta.wma / ta.hma and ta.atr in Pine Script v6
• Signal edges are close-based crossovers; dynamic alerts fire once per bar close, so nothing repaints intrabar
• All thresholds are inputs with minval/step guards; every module can be toggled independently
• Mozilla Public License 2.0 — original band concept (c) blackcat1402
█ LIMITATIONS
• Mean-reversion logic struggles in strong trends — price can ride a band for extended periods; use the cooldown and outer bands to adapt
• Signals are informational reference points, not trading advice
• Very low timeframes with tiny ATR values produce tight, noisy bands — prefer 15m and above
█ NOTES
• V2 polish: v6 migration, signal engine, risk references, alerts, dashboard and fills — band math and defaults are unchanged vs V1
• Test on chart with defaults before making trading decisions
════════════════════════════════════════════════════════════════════════
For questions or feedback, please use the comments section below.
Feel free to use and modify — attribution appreciated.

Don't miss out! The first and most important thing to do is to join my Discord chat now! Click here to start your adventure: discord.com/invite/ZTGpQJq My new github for more pine development soon: github.com/wxt-coder
إخلاء المسؤولية
لا يُقصد بالمعلومات والمنشورات أن تكون، أو تشكل، أي نصيحة مالية أو استثمارية أو تجارية أو أنواع أخرى من النصائح أو التوصيات المقدمة أو المعتمدة من TradingView. اقرأ المزيد في شروط الاستخدام.
Don't miss out! The first and most important thing to do is to join my Discord chat now! Click here to start your adventure: discord.com/invite/ZTGpQJq My new github for more pine development soon: github.com/wxt-coder
إخلاء المسؤولية
لا يُقصد بالمعلومات والمنشورات أن تكون، أو تشكل، أي نصيحة مالية أو استثمارية أو تجارية أو أنواع أخرى من النصائح أو التوصيات المقدمة أو المعتمدة من TradingView. اقرأ المزيد في شروط الاستخدام.