OPEN-SOURCE SCRIPT
Uptrick: Band Flow
Introduction
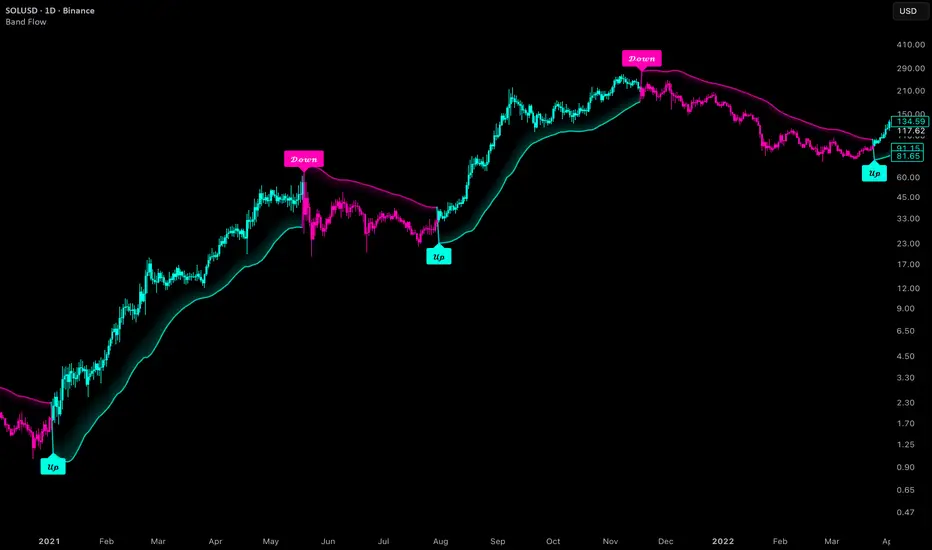
Uptrick: Band Flow is a trend overlay built from a smoothed moving-average baseline and ATR bands. The trend only changes when a bar closes outside the opposite band, so the trend color holds while price moves inside the envelope. When the trend changes, the script prints one Up or Down label and tracks five ATR-based target levels from the entry close.
Originality
The building blocks are standard: a weighted moving average, an EMA smoothing pass and ATR. What it adds is how they are assembled and why each piece is there:
The parts form one calculation chain rather than several unrelated indicators merged together: the baseline feeds the bands, the bands define the trend state, the trend state defines the signals, and the signals define the entry and target levels.
Features
Inputs
Trend Engine (group 01)
Overlay (group 02)
Signal Anchor (group 03)
ATR Take Profits (group 04)
Display (group 05)
How It Works
Baseline: a weighted moving average of close over Trend Length, then an EMA of that average over Trend Smoothing.
Bands: upper band is the baseline plus ATR times the Upper Band Multiplier. Lower band is the baseline minus ATR times the Lower Band Multiplier.
Trend state: bullish when a bar closes above the upper band after the previous bar closed at or below the upper band. Bearish is the mirror case below the lower band. While price stays inside the bands, the previous state is kept.
Signals: an Up label appears on a bullish break when the script is not already long. A Down label appears on a bearish break when the script is not already short. The close of that bar becomes the entry price and the ATR of that bar is stored.
Targets: each level is the entry price plus (long) or minus (short) the stored ATR times that level's multiplier. A level is marked when a bar's high (long) or low (short) reaches it. The position stays tracked until the opposite signal.
Trail: in an uptrend the inner edge is the lower band, and the outer edge is the smoothed baseline minus the smoothed ATR times (Lower Band Multiplier plus Trail Outer Expansion). In a downtrend the trail is mirrored above price.
How to Use
Conclusion
Band Flow combines a smoothed baseline, ATR bands, a trend state that only flips on a full breakout, a single-position signal and a fixed ATR target ladder in one overlay. It is a tool for reading trend state and measuring ATR distances from a breakout, not a complete trading system. Test the settings on the markets and timeframes you trade and combine it with your own analysis and risk management.
Uptrick: Band Flow is a trend overlay built from a smoothed moving-average baseline and ATR bands. The trend only changes when a bar closes outside the opposite band, so the trend color holds while price moves inside the envelope. When the trend changes, the script prints one Up or Down label and tracks five ATR-based target levels from the entry close.
Originality
The building blocks are standard: a weighted moving average, an EMA smoothing pass and ATR. What it adds is how they are assembled and why each piece is there:
- WMA baseline: weights recent closes more heavily than a simple average, so the center line reacts sooner at the same length.
- EMA smoothing pass: reduces bar-to-bar noise in the baseline so the band center does not jitter.
- ATR band width: scales the envelope to current volatility instead of a fixed price distance. Separate upper and lower multipliers allow an asymmetric envelope.
- Trend state with memory: price inside the bands keeps the previous trend, and only a close beyond the opposite band flips it. This replaces a plain baseline cross, so touching the center line alone does not change the trend.
- Single-position signal engine: a new label is only issued when direction changes, so repeated breakouts in the same direction do not stack signals.
- Entry-frozen ATR ladder: ATR is captured on the signal bar, so the five target levels stay fixed instead of moving with volatility after entry.
- Selectable signal anchor: label placement is separated from signal logic, so labels can sit on the trail edge or beyond the candle without changing when signals occur.
The parts form one calculation chain rather than several unrelated indicators merged together: the baseline feeds the bands, the bands define the trend state, the trend state defines the signals, and the signals define the entry and target levels.
Features
- Smoothed baseline: weighted moving average of close with an optional EMA smoothing pass
- ATR is floored at the symbol's minimum tick so band width never collapses to zero
- Upper and lower ATR bands with independent multipliers
- Trend state with memory: a close that crosses above the upper band turns the trend bullish, a close that crosses below the lower band turns it bearish, and price inside the bands keeps the previous state
- Trend changes are evaluated on confirmed bar closes only
- Three overlay modes: Center, Trail and Bands
- Center mode: baseline line in the trend color with a gradient fill between the baseline and price
- Trail mode: one-sided trail, lower trail in an uptrend and upper trail in a downtrend, with a gradient between the inner edge and an outer edge expanded by extra ATR
- Bands mode: full upper and lower envelope with a gradient that is strongest near the baseline
- Trend candles: candle body, border and wick colored by trend state (cyan for bullish, magenta for bearish)
- Up and Down labels, one per direction change, no pyramiding
- Two signal anchor modes: Bands and ATR
- Five ATR take-profit levels measured from the entry close, each marked with a small cross when reached
- Each take-profit level marks once per signal, and all levels reset on the next signal
- Dashboard in the top right corner, two columns by six rows: script name and trend state, trend direction, overlay mode, signal anchor mode, entry price, take-profit progress shown as five dots
- Seven alert conditions: Up, Down, TP1, TP2, TP3, TP4 and TP5
- Display toggles for signals, trend candles, dashboard and take-profit markers
- Written in Pine Script v6 using only the chart's own data, with no request.security calls
Inputs
Trend Engine (group 01)
- Trend Length (default 30): length of the weighted moving average baseline
- Trend Smoothing (default 4): EMA length applied to the baseline, set to 1 to switch the smoothing off
- Band ATR Length (default 14): ATR period used for band width and for the take-profit distances
- Upper Band Multiplier (default 1.50): ATR multiple added above the baseline
- Lower Band Multiplier (default 1.50): ATR multiple subtracted below the baseline
Overlay (group 02)
- Overlay Mode (default Bands): Center, Trail or Bands
- Trail Outer Expansion (default 0.85): extra ATR added to the outer trail edge. Also moves the labels when Signal Anchor is set to Bands
- Trail Smoothing (default 5): EMA length applied to the baseline and ATR used for the outer trail edge, set to 1 to switch off. Also moves the labels when Signal Anchor is set to Bands
Signal Anchor (group 03)
- Signal Anchor (default Bands): Bands places labels on the outer trail edge (below price for Up, above price for Down). ATR places them beyond the candle low or high. This changes label position only, not when signals occur
- Signal ATR Length (default 14): ATR period used for ATR-anchored labels
- Signal ATR Distance (default 0.80): ATR multiple between the candle low or high and the label
ATR Take Profits (group 04)
- Show ATR Take Profits (default on): switches take-profit markers and take-profit alerts on or off
- TP1 ATR, TP2 ATR, TP3 ATR, TP4 ATR, TP5 ATR (defaults 1.0, 2.0, 3.0, 4.0, 5.0): ATR multiple for each target level, measured from the entry close
Display (group 05)
- Show Signals (default on): Up and Down labels
- Trend Candles (default on): trend-colored candles
- Dashboard (default on): dashboard table
How It Works
Baseline: a weighted moving average of close over Trend Length, then an EMA of that average over Trend Smoothing.
Bands: upper band is the baseline plus ATR times the Upper Band Multiplier. Lower band is the baseline minus ATR times the Lower Band Multiplier.
Trend state: bullish when a bar closes above the upper band after the previous bar closed at or below the upper band. Bearish is the mirror case below the lower band. While price stays inside the bands, the previous state is kept.
Signals: an Up label appears on a bullish break when the script is not already long. A Down label appears on a bearish break when the script is not already short. The close of that bar becomes the entry price and the ATR of that bar is stored.
Targets: each level is the entry price plus (long) or minus (short) the stored ATR times that level's multiplier. A level is marked when a bar's high (long) or low (short) reaches it. The position stays tracked until the opposite signal.
Trail: in an uptrend the inner edge is the lower band, and the outer edge is the smoothed baseline minus the smoothed ATR times (Lower Band Multiplier plus Trail Outer Expansion). In a downtrend the trail is mirrored above price.
How to Use
- Use standard candlestick or bar charts. Heikin Ashi, Renko, Kagi, Point and Figure and Range charts do not show real traded prices, so signals and targets on them would not be realistic
- Read the trend from the color: cyan is bullish, magenta is bearish. The color only changes when a close breaks the opposite band
- Treat an Up or Down label as confirmation that a close has left the envelope, not as an early warning
- Tune the band multipliers to set how far price must travel from the baseline before the trend flips: smaller multipliers generally flip sooner and more often, larger multipliers generally flip later and less often. Trend Length changes how closely the baseline follows price, which moves where the bands sit, so test length changes on your own markets rather than assuming a direction
- Pick the overlay mode you prefer: Center for a minimal view, Trail for a one-sided trail, Bands for the full envelope
- Use the ATR targets as reference distances from entry. They are not orders or predictions
- For alerts, open the alert dialog, select Band Flow and choose a condition. Up and Down conditions are only true on a bar close. Take-profit conditions can become true while a bar is still forming, so choose the alert frequency accordingly
Conclusion
Band Flow combines a smoothed baseline, ATR bands, a trend state that only flips on a full breakout, a single-position signal and a fixed ATR target ladder in one overlay. It is a tool for reading trend state and measuring ATR distances from a breakout, not a complete trading system. Test the settings on the markets and timeframes you trade and combine it with your own analysis and risk management.
Disclaimer
This script is for educational and informational purposes only and is not financial advice. Trading involves risk, including the loss of capital. Past behavior of any indicator does not guarantee future results. Always do your own research and use your own risk management.
نص برمجي مفتوح المصدر
بروح TradingView الحقيقية، قام مبتكر هذا النص البرمجي بجعله مفتوح المصدر، بحيث يمكن للمتداولين مراجعة وظائفه والتحقق منها. شكرا للمؤلف! بينما يمكنك استخدامه مجانًا، تذكر أن إعادة نشر الكود يخضع لقواعد الموقع الخاصة بنا.

💎 Free Discord: discord.gg/Def47ueyuD
💎 Website: uptrick.io
Nothing is financial advice. Always do your own research.
💎 Website: uptrick.io
Nothing is financial advice. Always do your own research.
إخلاء المسؤولية
لا يُقصد بالمعلومات والمنشورات أن تكون، أو تشكل، أي نصيحة مالية أو استثمارية أو تجارية أو أنواع أخرى من النصائح أو التوصيات المقدمة أو المعتمدة من TradingView. اقرأ المزيد في شروط الاستخدام.
نص برمجي مفتوح المصدر
بروح TradingView الحقيقية، قام مبتكر هذا النص البرمجي بجعله مفتوح المصدر، بحيث يمكن للمتداولين مراجعة وظائفه والتحقق منها. شكرا للمؤلف! بينما يمكنك استخدامه مجانًا، تذكر أن إعادة نشر الكود يخضع لقواعد الموقع الخاصة بنا.
💎 Free Discord: discord.gg/Def47ueyuD
💎 Website: uptrick.io
Nothing is financial advice. Always do your own research.
💎 Website: uptrick.io
Nothing is financial advice. Always do your own research.
إخلاء المسؤولية
لا يُقصد بالمعلومات والمنشورات أن تكون، أو تشكل، أي نصيحة مالية أو استثمارية أو تجارية أو أنواع أخرى من النصائح أو التوصيات المقدمة أو المعتمدة من TradingView. اقرأ المزيد في شروط الاستخدام.