OPEN-SOURCE SCRIPT
FVG Trade Entries
FVG TRADE ENTRIES
tradingview.com/u/Forex_Market_Insights/
OVERVIEW
FVG Trade Entries is a complete Fair Value Gap trading framework. It finds the price imbalances that a fast move leaves behind, stores every one of them as a live zone, waits for price to return and tap that zone, and then builds a full trade structure around it: entry, invalidation, and four risk-based targets, all drawn on the chart and all scaled automatically to the instrument and timeframe you are on.
A Fair Value Gap is a window of price that never traded properly. When a market moves aggressively in one direction, the middle candle of a three-candle sequence can travel so far that the first and third candles never overlap. That untraded window is an inefficiency, and markets have a strong tendency to return to it before continuing. This indicator exists to find those windows, wait for the return, and turn it into a measurable trade with defined risk.
The tool draws nothing arbitrary. Every level it plots is derived from the gap itself, from ATR, or from a multiple of the risk you are actually taking.
━━━━━━━━━━━━━━━━━━━━━━━━━━━━━━━━━━━━━━━━━━━━━━━━━━━━━━━━━━━━━━━━━━━━━━━━━━
WHY THIS INDICATOR WAS CREATED
Four specific problems drove this build.
1. Most Fair Value Gap tools stop at drawing the box.
They mark the imbalance and leave the trader to work out everything else manually. Where is entry, where does the stop go, how far is a realistic target, and is the reward even worth the risk. That manual work is where most inconsistency comes from. This indicator completes the job: the moment a gap is tapped, the full trade structure appears already measured.
2. Repeated signals on the same zone.
If a tool fires every bar that price spends inside a gap, a single zone can produce a dozen identical alerts. That makes alerts useless and backtesting meaningless. This indicator locks each zone after it fires, so one gap produces one setup.
3. Fixed pip and point values break across markets.
A stop of twenty pips is reasonable on EURUSD and absurd on Bitcoin. A twenty point target is nothing on an index and enormous on a currency pair. Any tool built on fixed distances has to be re-tuned for every symbol and every timeframe. This one uses no fixed distances anywhere.
4. Micro-gaps clutter fast charts.
On a one-minute or five-minute chart, tiny one-tick imbalances form constantly and mean nothing. A size filter was needed, but it had to be relative rather than absolute, otherwise it reintroduces the same cross-market problem. Here the filter is expressed in ATR multiples, so it self-adjusts.
━━━━━━━━━━━━━━━━━━━━━━━━━━━━━━━━━━━━━━━━━━━━━━━━━━━━━━━━━━━━━━━━━━━━━━━━━━
HOW IT WORKS, FULL METHODOLOGY
1. FAIR VALUE GAP DETECTION
The engine examines every three-candle sequence as it completes.
A bullish Fair Value Gap is registered when the current bar's low sits entirely above the high recorded two bars back. The window between that old high and the new low is price that was skipped during an upward displacement. It becomes a demand zone.
A bearish Fair Value Gap is the mirror image: the current bar's high sits entirely below the low from two bars back. The window between them was skipped during a downward displacement. It becomes a supply zone.
Detection is gated on confirmed bars only, so a zone is never created from an unfinished candle and never vanishes once drawn.
2. SIZE FILTERING
Every detected gap is measured against current ATR before it is accepted. Gaps smaller than the configured ATR multiple are discarded entirely and never enter the registry. Because the filter is relative to the instrument's own volatility, raising it removes noise equally well on a five-minute gold chart and a daily currency chart, with no re-tuning.
3. ZONE REGISTRY AND MITIGATION
Accepted gaps are stored in a live registry rather than simply drawn and forgotten. Each stored zone knows its own boundaries, its direction, whether it has already produced a setup, and whether it has been mitigated.
While a zone remains unfilled it extends to the right with price, so you can always see which imbalances are still open. A zone is marked as mitigated once price has closed completely through it, meaning the inefficiency has been rebalanced and the zone has done its job. You can choose whether mitigated zones stay on the chart as history or are removed.
The registry is capped, so the oldest zones are retired automatically and the chart never fills with drawings.
4. TAP TRIGGER AND SINGLE-FIRE LOCKING
A setup is generated only when price returns and trades back into an unmitigated zone.
For a bullish gap this means price falling back down into the demand window. For a bearish gap it means price rising back into the supply window. The formation bar itself is excluded, so a gap can never trigger on the same candle that created it.
The instant a zone fires, it is locked. With "Only First Tap Per Zone" enabled, that zone will never produce another setup no matter how many times price revisits it. This is what keeps one imbalance equal to one trade.
An optional "One Active Setup At A Time" mode holds new setups back while an existing one is still running, which keeps the chart readable and mirrors how most traders actually manage a single position.
5. OPTIONAL HIGHER-TIMEFRAME GATE
When enabled, an EMA on a higher timeframe of your choosing acts as a directional filter. Long setups are permitted only while price trades above it and short setups only while price trades below it. This removes counter-trend taps in strongly trending conditions. The higher-timeframe value is requested with lookahead disabled so no future information enters the calculation.
6. ENTRY, STOP AND FOUR TARGETS
Entry.
By default, entry is taken at the near edge of the gap, which is the first level price touches on its return. Alternatively you can select the zone midpoint, the fifty percent equilibrium of the imbalance, which gives a deeper and more conservative fill.
Stop loss.
Invalidation is placed beyond the far edge of the gap, plus an ATR buffer. Placing the stop exactly on the boundary invites being wicked out by the same liquidity sweep that often precedes the real move, so the buffer pushes it outside the structure. Because the buffer is expressed in ATR, it widens automatically on volatile instruments and tightens on quiet ones.
Targets.
The distance between entry and stop is the initial risk. All four targets are then projected as multiples of that risk, using the R:R values you set. Defaults are one, two, three and four times risk. Because the ladder is built on risk rather than on price constants, the same configuration produces sensible targets on a five-minute gold chart, a four-hour currency chart and a daily crypto chart without touching a single input.
7. LIVE SETUP TRACKING
Once a setup exists it is tracked bar by bar. Its risk region, reward region, level lines, labels and projection line all extend forward with price while the trade is unresolved.
The moment the final target is reached, or the stop is reached, the setup freezes exactly where it resolved and stays on the chart as a permanent record. Scrolling back through history therefore shows you every setup the logic produced and exactly how each one finished, which is what makes honest visual review possible.
━━━━━━━━━━━━━━━━━━━━━━━━━━━━━━━━━━━━━━━━━━━━━━━━━━━━━━━━━━━━━━━━━━━━━━━━━━
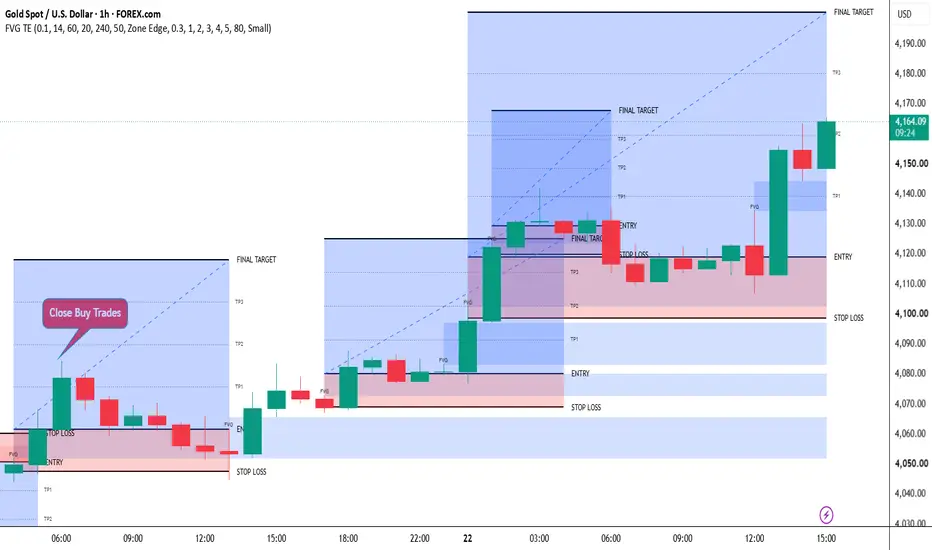
HOW TO READ IT ON THE CHART
- Shaded gap box, tagged FVG, is the detected imbalance. Blue for bullish demand, red for bearish supply.
- ENTRY line marks the level the setup is measured from.
- STOP LOSS line marks invalidation, sitting beyond the far edge of the gap plus its ATR buffer.
- The red shaded region between entry and stop is what you are risking.
- The blue shaded region between entry and the final target is what you stand to gain.
- The dashed diagonal line projects from entry to the final target, showing the intended path of the trade.
- FINAL TARGET labels the fourth and furthest objective.
- Dotted lines labelled TP1, TP2 and TP3 mark the intermediate objectives on the way there.
- A frozen setup means the trade finished, either at the final target or at the stop.
The visual proportion between the red and blue regions is deliberate. You can see the reward-to-risk relationship of a setup at a glance, before reading a single number.
━━━━━━━━━━━━━━━━━━━━━━━━━━━━━━━━━━━━━━━━━━━━━━━━━━━━━━━━━━━━━━━━━━━━━━━━━━
PRACTICAL USE
Basic workflow.
Wait for a gap to form, let price move away, and then watch for the return. The setup appears automatically on the tap. Entry, stop and targets are already calculated, so the only decision left is position size and whether the context supports the trade.
Choosing an entry mode.
Zone Edge fills earlier and catches moves that only shallowly retest the imbalance, but it produces a wider stop relative to entry. Zone Midpoint gives a better price and a tighter risk, but deep retests do not always happen, so some setups will move away without filling. Fast intraday charts generally favour Zone Edge. Higher timeframes, where retests tend to be deeper, often favour the midpoint.
Managing the targets.
The four-target ladder is designed for scaling. A common approach is to reduce risk at TP1, take partial profit at TP2 and TP3, and let the remainder run to the final target. If you prefer a single objective, set all four R:R values close together and treat the final target as your only exit.
Using the filters.
If the chart shows too many setups, raise the minimum gap size in ATR multiples first, before touching anything else. It is the single most effective control. Enable the higher-timeframe gate when a market is clearly trending and you want to stop taking counter-trend taps. Turn "One Active Setup At A Time" off only if you intend to manage multiple positions in parallel.
Reading unfilled zones.
Zones that remain unmitigated are open inefficiencies. Even when you do not trade them directly, they are useful context: they mark levels price has unfinished business with, and they often act as magnets during retracements.
Confluence.
The strongest applications come from combining the gap with independent context, such as a gap that sits inside a higher-timeframe area of interest, or one that forms in the direction of a clear structural break. The indicator marks the imbalance and measures the trade; the surrounding market context is still yours to read.
━━━━━━━━━━━━━━━━━━━━━━━━━━━━━━━━━━━━━━━━━━━━━━━━━━━━━━━━━━━━━━━━━━━━━━━━━━
SETTINGS
FAIR VALUE GAP DETECTION
- Show FVG Zones, turns the zone drawings on or off.
- Min FVG Size (x ATR), gaps smaller than this multiple of ATR are ignored completely. The primary noise control.
- ATR Length, the volatility baseline used by the size filter and the stop buffer.
- Extend Zone Until Mitigated, unfilled zones keep extending right with price.
- Zone Extension (bars), fixed forward length used when the setting above is off.
- Max Zones Tracked, how many zones are kept before the oldest are retired.
- Delete Zone Once Mitigated, remove filled zones instead of keeping them as history.
- Show FVG Tag, the small FVG text on each zone.
SETUP FILTERS
- Only First Tap Per Zone, one setup per imbalance. Recommended on.
- One Active Setup At A Time, holds new setups back while one is still running.
- Allow Long Setups and Allow Short Setups, trade one direction only if you wish.
- Higher-Timeframe Trend Filter, restricts setups to the higher-timeframe direction.
- Filter Timeframe and Filter EMA Length, the reference used by that gate.
ENTRY, STOP AND TARGETS
- Entry Mode, Zone Edge or Zone Midpoint.
- SL Buffer (x ATR), how far beyond the gap's far edge invalidation is pushed.
- TP1 to TP4 R:R, the four targets expressed as multiples of initial risk.
- Max Setups On Chart, how many completed setups are retained.
- Setup Projection (bars), how far a resolved setup is drawn forward.
VISUALS
- Shade Risk Region, Shade Reward Region, Show Projection Line, Show TP1 to TP3 Lines, Show Level Labels, Label Size.
STYLE
- Full colour control over bullish and bearish zones, risk and reward regions, entry, stop and target lines, the projection line and all label text.
━━━━━━━━━━━━━━━━━━━━━━━━━━━━━━━━━━━━━━━━━━━━━━━━━━━━━━━━━━━━━━━━━━━━━━━━━━
UNIVERSAL MARKET AND TIMEFRAME COMPATIBILITY
There are no pip values, point distances or price constants anywhere in the logic. Every measurement is derived from one of three sources: current ATR, the gap's own height, or a multiple of the initial risk. All three self-scale.
The practical result is that the identical configuration behaves correctly on Forex majors and exotics, on gold and other metals, on indices, on crypto and on individual equities, from one-minute charts up to monthly, without editing a single input for each new instrument.
━━━━━━━━━━━━━━━━━━━━━━━━━━━━━━━━━━━━━━━━━━━━━━━━━━━━━━━━━━━━━━━━━━━━━━━━━━
ALERTS
Four alert conditions are included:
- Bullish FVG Tap, Long Setup. Price tapped an unmitigated bullish gap and a long setup was generated.
- Bearish FVG Tap, Short Setup. Price tapped an unmitigated bearish gap and a short setup was generated.
- Target Reached. An active setup reached its first objective.
- Stop Loss Reached. An active setup was invalidated.
Alert messages carry the ticker and timeframe automatically, so you can run them across a watchlist without keeping charts open.
━━━━━━━━━━━━━━━━━━━━━━━━━━━━━━━━━━━━━━━━━━━━━━━━━━━━━━━━━━━━━━━━━━━━━━━━━━
REPAINTING STATEMENT
Gap detection and tap confirmation are both gated on confirmed bars. A zone is never created from an unfinished candle, and a setup is never generated from one. Entry, stop and all four targets are fixed at the moment the setup is produced and are never recalculated afterwards.
Historical zones and historical setups do not move, do not disappear and do not change their levels. The optional higher-timeframe filter is requested with lookahead disabled, so no future data can influence a past bar.
━━━━━━━━━━━━━━━━━━━━━━━━━━━━━━━━━━━━━━━━━━━━━━━━━━━━━━━━━━━━━━━━━━━━━━━━━━
HONEST LIMITATIONS
- Not every Fair Value Gap gets filled, and not every filled gap reverses from it. A significant number of zones will simply be traded through. The size filter and the higher-timeframe gate reduce this, but they cannot eliminate it.
- Confirmation on closed bars means a setup appears at the close of the tap candle, not at the exact tick that touched the zone. This is a deliberate trade-off: it costs a little entry precision and removes intrabar repainting entirely.
- The four targets are geometric projections of risk. They describe what the trade is worth if it works. They are not predictions that price will reach them, and no risk-multiple is achievable on every setup.
- The stop buffer reduces wick-outs but cannot prevent them. Deep liquidity sweeps below a demand zone happen, and a fixed rule can never anticipate all of them.
- This indicator identifies structure and measures trades. It does not manage risk for you and does not predict direction. Position sizing and trade management remain entirely your responsibility.
━━━━━━━━━━━━━━━━━━━━━━━━━━━━━━━━━━━━━━━━━━━━━━━━━━━━━━━━━━━━━━━━━━━━━━━━━━
AUTHOR VERIFICATION DECLARATION
I am Forex_Market_Insights, the publisher and sole original author of this exact implementation of FVG Trade Entries. I designed the structure of this tool, wrote every line of the Pine Script v6 code it contains, tested it across multiple asset classes and timeframes, and I take full and sole ownership and responsibility for it.
Specifically, I independently designed and coded: the three-candle Fair Value Gap detection routine and its confirmation gating; the ATR-relative minimum gap size filter; the object-based zone registry that tracks every unmitigated gap; the first-tap detection and per-zone single-fire locking that prevents duplicate signals; the optional higher-timeframe trend gate; the entry resolution model with selectable zone-edge and equilibrium modes; the ATR-buffered invalidation engine; the risk-multiple target ladder producing four take-profit levels; the complete visual system of zones, risk and reward regions, level lines, right-anchored labels and the diagonal trade projection; the live trade-state tracker that extends a setup until it resolves and then freezes it; and the alert framework.
This declaration is made for this specific version of the script, version 6.0, July 2026. Any future modified version I publish will carry its own updated declaration in the script header.
━━━━━━━━━━━━━━━━━━━━━━━━━━━━━━━━━━━━━━━━━━━━━━━━━━━━━━━━━━━━━━━━━━━━━━━━━━
ORIGINAL SCRIPT IMPLEMENTATION VERIFICATION AND DECLARATION
I verify and declare that this script is an original implementation authored from scratch by Forex_Market_Insights. No portion of this code was copied, ported, decompiled, translated, reverse-engineered or adapted from any other author's closed-source, invite-only, protected or open-source script. No third-party library, no republished open-source script and no re-skinned built-in indicator forms any part of this work.
I acknowledge openly that the underlying trading concepts used here are publicly documented and widely taught in the trading community: the Fair Value Gap or three-candle imbalance, the idea of price returning to rebalance an inefficiency, invalidation placed beyond a zone's far edge, and targets expressed as multiples of initial risk. These concepts are public knowledge and belong to no single author.
My original contribution, and what this declaration covers, is the specific code implementation of those concepts: my own formulas, my own data structures, my own state-management architecture, my own filtering and locking logic, and my own visual and alert design. Conceptual overlap with other tools that also discuss Fair Value Gaps is therefore unavoidable and expected, but there is no source-code overlap of any kind.
Standard Pine Script built-in functions, and the drawing primitives box, line and label, are used only as low-level language facilities inside my own engine, in the same way any developer uses a programming language's standard library.
The full commented source, including both of these declarations, is contained in the script header.
━━━━━━━━━━━━━━━━━━━━━━━━━━━━━━━━━━━━━━━━━━━━━━━━━━━━━━━━━━━━━━━━━━━━━━━━━━
DISCLAIMER
This tool is for educational and informational purposes only. It does not constitute financial advice. Trading involves risk and past patterns do not guarantee future results. No signal produced by this indicator is a recommendation to enter or exit any position. Use proper risk management, test thoroughly on your own instruments and timeframes, and consult a licensed financial advisor before trading real capital. All trading decisions and all risk taken remain entirely your own responsibility.
tradingview.com/u/Forex_Market_Insights/
tradingview.com/u/Forex_Market_Insights/
OVERVIEW
FVG Trade Entries is a complete Fair Value Gap trading framework. It finds the price imbalances that a fast move leaves behind, stores every one of them as a live zone, waits for price to return and tap that zone, and then builds a full trade structure around it: entry, invalidation, and four risk-based targets, all drawn on the chart and all scaled automatically to the instrument and timeframe you are on.
A Fair Value Gap is a window of price that never traded properly. When a market moves aggressively in one direction, the middle candle of a three-candle sequence can travel so far that the first and third candles never overlap. That untraded window is an inefficiency, and markets have a strong tendency to return to it before continuing. This indicator exists to find those windows, wait for the return, and turn it into a measurable trade with defined risk.
The tool draws nothing arbitrary. Every level it plots is derived from the gap itself, from ATR, or from a multiple of the risk you are actually taking.
━━━━━━━━━━━━━━━━━━━━━━━━━━━━━━━━━━━━━━━━━━━━━━━━━━━━━━━━━━━━━━━━━━━━━━━━━━
WHY THIS INDICATOR WAS CREATED
Four specific problems drove this build.
1. Most Fair Value Gap tools stop at drawing the box.
They mark the imbalance and leave the trader to work out everything else manually. Where is entry, where does the stop go, how far is a realistic target, and is the reward even worth the risk. That manual work is where most inconsistency comes from. This indicator completes the job: the moment a gap is tapped, the full trade structure appears already measured.
2. Repeated signals on the same zone.
If a tool fires every bar that price spends inside a gap, a single zone can produce a dozen identical alerts. That makes alerts useless and backtesting meaningless. This indicator locks each zone after it fires, so one gap produces one setup.
3. Fixed pip and point values break across markets.
A stop of twenty pips is reasonable on EURUSD and absurd on Bitcoin. A twenty point target is nothing on an index and enormous on a currency pair. Any tool built on fixed distances has to be re-tuned for every symbol and every timeframe. This one uses no fixed distances anywhere.
4. Micro-gaps clutter fast charts.
On a one-minute or five-minute chart, tiny one-tick imbalances form constantly and mean nothing. A size filter was needed, but it had to be relative rather than absolute, otherwise it reintroduces the same cross-market problem. Here the filter is expressed in ATR multiples, so it self-adjusts.
━━━━━━━━━━━━━━━━━━━━━━━━━━━━━━━━━━━━━━━━━━━━━━━━━━━━━━━━━━━━━━━━━━━━━━━━━━
HOW IT WORKS, FULL METHODOLOGY
1. FAIR VALUE GAP DETECTION
The engine examines every three-candle sequence as it completes.
A bullish Fair Value Gap is registered when the current bar's low sits entirely above the high recorded two bars back. The window between that old high and the new low is price that was skipped during an upward displacement. It becomes a demand zone.
A bearish Fair Value Gap is the mirror image: the current bar's high sits entirely below the low from two bars back. The window between them was skipped during a downward displacement. It becomes a supply zone.
Detection is gated on confirmed bars only, so a zone is never created from an unfinished candle and never vanishes once drawn.
2. SIZE FILTERING
Every detected gap is measured against current ATR before it is accepted. Gaps smaller than the configured ATR multiple are discarded entirely and never enter the registry. Because the filter is relative to the instrument's own volatility, raising it removes noise equally well on a five-minute gold chart and a daily currency chart, with no re-tuning.
3. ZONE REGISTRY AND MITIGATION
Accepted gaps are stored in a live registry rather than simply drawn and forgotten. Each stored zone knows its own boundaries, its direction, whether it has already produced a setup, and whether it has been mitigated.
While a zone remains unfilled it extends to the right with price, so you can always see which imbalances are still open. A zone is marked as mitigated once price has closed completely through it, meaning the inefficiency has been rebalanced and the zone has done its job. You can choose whether mitigated zones stay on the chart as history or are removed.
The registry is capped, so the oldest zones are retired automatically and the chart never fills with drawings.
4. TAP TRIGGER AND SINGLE-FIRE LOCKING
A setup is generated only when price returns and trades back into an unmitigated zone.
For a bullish gap this means price falling back down into the demand window. For a bearish gap it means price rising back into the supply window. The formation bar itself is excluded, so a gap can never trigger on the same candle that created it.
The instant a zone fires, it is locked. With "Only First Tap Per Zone" enabled, that zone will never produce another setup no matter how many times price revisits it. This is what keeps one imbalance equal to one trade.
An optional "One Active Setup At A Time" mode holds new setups back while an existing one is still running, which keeps the chart readable and mirrors how most traders actually manage a single position.
5. OPTIONAL HIGHER-TIMEFRAME GATE
When enabled, an EMA on a higher timeframe of your choosing acts as a directional filter. Long setups are permitted only while price trades above it and short setups only while price trades below it. This removes counter-trend taps in strongly trending conditions. The higher-timeframe value is requested with lookahead disabled so no future information enters the calculation.
6. ENTRY, STOP AND FOUR TARGETS
Entry.
By default, entry is taken at the near edge of the gap, which is the first level price touches on its return. Alternatively you can select the zone midpoint, the fifty percent equilibrium of the imbalance, which gives a deeper and more conservative fill.
Stop loss.
Invalidation is placed beyond the far edge of the gap, plus an ATR buffer. Placing the stop exactly on the boundary invites being wicked out by the same liquidity sweep that often precedes the real move, so the buffer pushes it outside the structure. Because the buffer is expressed in ATR, it widens automatically on volatile instruments and tightens on quiet ones.
Targets.
The distance between entry and stop is the initial risk. All four targets are then projected as multiples of that risk, using the R:R values you set. Defaults are one, two, three and four times risk. Because the ladder is built on risk rather than on price constants, the same configuration produces sensible targets on a five-minute gold chart, a four-hour currency chart and a daily crypto chart without touching a single input.
7. LIVE SETUP TRACKING
Once a setup exists it is tracked bar by bar. Its risk region, reward region, level lines, labels and projection line all extend forward with price while the trade is unresolved.
The moment the final target is reached, or the stop is reached, the setup freezes exactly where it resolved and stays on the chart as a permanent record. Scrolling back through history therefore shows you every setup the logic produced and exactly how each one finished, which is what makes honest visual review possible.
━━━━━━━━━━━━━━━━━━━━━━━━━━━━━━━━━━━━━━━━━━━━━━━━━━━━━━━━━━━━━━━━━━━━━━━━━━
HOW TO READ IT ON THE CHART
- Shaded gap box, tagged FVG, is the detected imbalance. Blue for bullish demand, red for bearish supply.
- ENTRY line marks the level the setup is measured from.
- STOP LOSS line marks invalidation, sitting beyond the far edge of the gap plus its ATR buffer.
- The red shaded region between entry and stop is what you are risking.
- The blue shaded region between entry and the final target is what you stand to gain.
- The dashed diagonal line projects from entry to the final target, showing the intended path of the trade.
- FINAL TARGET labels the fourth and furthest objective.
- Dotted lines labelled TP1, TP2 and TP3 mark the intermediate objectives on the way there.
- A frozen setup means the trade finished, either at the final target or at the stop.
The visual proportion between the red and blue regions is deliberate. You can see the reward-to-risk relationship of a setup at a glance, before reading a single number.
━━━━━━━━━━━━━━━━━━━━━━━━━━━━━━━━━━━━━━━━━━━━━━━━━━━━━━━━━━━━━━━━━━━━━━━━━━
PRACTICAL USE
Basic workflow.
Wait for a gap to form, let price move away, and then watch for the return. The setup appears automatically on the tap. Entry, stop and targets are already calculated, so the only decision left is position size and whether the context supports the trade.
Choosing an entry mode.
Zone Edge fills earlier and catches moves that only shallowly retest the imbalance, but it produces a wider stop relative to entry. Zone Midpoint gives a better price and a tighter risk, but deep retests do not always happen, so some setups will move away without filling. Fast intraday charts generally favour Zone Edge. Higher timeframes, where retests tend to be deeper, often favour the midpoint.
Managing the targets.
The four-target ladder is designed for scaling. A common approach is to reduce risk at TP1, take partial profit at TP2 and TP3, and let the remainder run to the final target. If you prefer a single objective, set all four R:R values close together and treat the final target as your only exit.
Using the filters.
If the chart shows too many setups, raise the minimum gap size in ATR multiples first, before touching anything else. It is the single most effective control. Enable the higher-timeframe gate when a market is clearly trending and you want to stop taking counter-trend taps. Turn "One Active Setup At A Time" off only if you intend to manage multiple positions in parallel.
Reading unfilled zones.
Zones that remain unmitigated are open inefficiencies. Even when you do not trade them directly, they are useful context: they mark levels price has unfinished business with, and they often act as magnets during retracements.
Confluence.
The strongest applications come from combining the gap with independent context, such as a gap that sits inside a higher-timeframe area of interest, or one that forms in the direction of a clear structural break. The indicator marks the imbalance and measures the trade; the surrounding market context is still yours to read.
━━━━━━━━━━━━━━━━━━━━━━━━━━━━━━━━━━━━━━━━━━━━━━━━━━━━━━━━━━━━━━━━━━━━━━━━━━
SETTINGS
FAIR VALUE GAP DETECTION
- Show FVG Zones, turns the zone drawings on or off.
- Min FVG Size (x ATR), gaps smaller than this multiple of ATR are ignored completely. The primary noise control.
- ATR Length, the volatility baseline used by the size filter and the stop buffer.
- Extend Zone Until Mitigated, unfilled zones keep extending right with price.
- Zone Extension (bars), fixed forward length used when the setting above is off.
- Max Zones Tracked, how many zones are kept before the oldest are retired.
- Delete Zone Once Mitigated, remove filled zones instead of keeping them as history.
- Show FVG Tag, the small FVG text on each zone.
SETUP FILTERS
- Only First Tap Per Zone, one setup per imbalance. Recommended on.
- One Active Setup At A Time, holds new setups back while one is still running.
- Allow Long Setups and Allow Short Setups, trade one direction only if you wish.
- Higher-Timeframe Trend Filter, restricts setups to the higher-timeframe direction.
- Filter Timeframe and Filter EMA Length, the reference used by that gate.
ENTRY, STOP AND TARGETS
- Entry Mode, Zone Edge or Zone Midpoint.
- SL Buffer (x ATR), how far beyond the gap's far edge invalidation is pushed.
- TP1 to TP4 R:R, the four targets expressed as multiples of initial risk.
- Max Setups On Chart, how many completed setups are retained.
- Setup Projection (bars), how far a resolved setup is drawn forward.
VISUALS
- Shade Risk Region, Shade Reward Region, Show Projection Line, Show TP1 to TP3 Lines, Show Level Labels, Label Size.
STYLE
- Full colour control over bullish and bearish zones, risk and reward regions, entry, stop and target lines, the projection line and all label text.
━━━━━━━━━━━━━━━━━━━━━━━━━━━━━━━━━━━━━━━━━━━━━━━━━━━━━━━━━━━━━━━━━━━━━━━━━━
UNIVERSAL MARKET AND TIMEFRAME COMPATIBILITY
There are no pip values, point distances or price constants anywhere in the logic. Every measurement is derived from one of three sources: current ATR, the gap's own height, or a multiple of the initial risk. All three self-scale.
The practical result is that the identical configuration behaves correctly on Forex majors and exotics, on gold and other metals, on indices, on crypto and on individual equities, from one-minute charts up to monthly, without editing a single input for each new instrument.
━━━━━━━━━━━━━━━━━━━━━━━━━━━━━━━━━━━━━━━━━━━━━━━━━━━━━━━━━━━━━━━━━━━━━━━━━━
ALERTS
Four alert conditions are included:
- Bullish FVG Tap, Long Setup. Price tapped an unmitigated bullish gap and a long setup was generated.
- Bearish FVG Tap, Short Setup. Price tapped an unmitigated bearish gap and a short setup was generated.
- Target Reached. An active setup reached its first objective.
- Stop Loss Reached. An active setup was invalidated.
Alert messages carry the ticker and timeframe automatically, so you can run them across a watchlist without keeping charts open.
━━━━━━━━━━━━━━━━━━━━━━━━━━━━━━━━━━━━━━━━━━━━━━━━━━━━━━━━━━━━━━━━━━━━━━━━━━
REPAINTING STATEMENT
Gap detection and tap confirmation are both gated on confirmed bars. A zone is never created from an unfinished candle, and a setup is never generated from one. Entry, stop and all four targets are fixed at the moment the setup is produced and are never recalculated afterwards.
Historical zones and historical setups do not move, do not disappear and do not change their levels. The optional higher-timeframe filter is requested with lookahead disabled, so no future data can influence a past bar.
━━━━━━━━━━━━━━━━━━━━━━━━━━━━━━━━━━━━━━━━━━━━━━━━━━━━━━━━━━━━━━━━━━━━━━━━━━
HONEST LIMITATIONS
- Not every Fair Value Gap gets filled, and not every filled gap reverses from it. A significant number of zones will simply be traded through. The size filter and the higher-timeframe gate reduce this, but they cannot eliminate it.
- Confirmation on closed bars means a setup appears at the close of the tap candle, not at the exact tick that touched the zone. This is a deliberate trade-off: it costs a little entry precision and removes intrabar repainting entirely.
- The four targets are geometric projections of risk. They describe what the trade is worth if it works. They are not predictions that price will reach them, and no risk-multiple is achievable on every setup.
- The stop buffer reduces wick-outs but cannot prevent them. Deep liquidity sweeps below a demand zone happen, and a fixed rule can never anticipate all of them.
- This indicator identifies structure and measures trades. It does not manage risk for you and does not predict direction. Position sizing and trade management remain entirely your responsibility.
━━━━━━━━━━━━━━━━━━━━━━━━━━━━━━━━━━━━━━━━━━━━━━━━━━━━━━━━━━━━━━━━━━━━━━━━━━
AUTHOR VERIFICATION DECLARATION
I am Forex_Market_Insights, the publisher and sole original author of this exact implementation of FVG Trade Entries. I designed the structure of this tool, wrote every line of the Pine Script v6 code it contains, tested it across multiple asset classes and timeframes, and I take full and sole ownership and responsibility for it.
Specifically, I independently designed and coded: the three-candle Fair Value Gap detection routine and its confirmation gating; the ATR-relative minimum gap size filter; the object-based zone registry that tracks every unmitigated gap; the first-tap detection and per-zone single-fire locking that prevents duplicate signals; the optional higher-timeframe trend gate; the entry resolution model with selectable zone-edge and equilibrium modes; the ATR-buffered invalidation engine; the risk-multiple target ladder producing four take-profit levels; the complete visual system of zones, risk and reward regions, level lines, right-anchored labels and the diagonal trade projection; the live trade-state tracker that extends a setup until it resolves and then freezes it; and the alert framework.
This declaration is made for this specific version of the script, version 6.0, July 2026. Any future modified version I publish will carry its own updated declaration in the script header.
━━━━━━━━━━━━━━━━━━━━━━━━━━━━━━━━━━━━━━━━━━━━━━━━━━━━━━━━━━━━━━━━━━━━━━━━━━
ORIGINAL SCRIPT IMPLEMENTATION VERIFICATION AND DECLARATION
I verify and declare that this script is an original implementation authored from scratch by Forex_Market_Insights. No portion of this code was copied, ported, decompiled, translated, reverse-engineered or adapted from any other author's closed-source, invite-only, protected or open-source script. No third-party library, no republished open-source script and no re-skinned built-in indicator forms any part of this work.
I acknowledge openly that the underlying trading concepts used here are publicly documented and widely taught in the trading community: the Fair Value Gap or three-candle imbalance, the idea of price returning to rebalance an inefficiency, invalidation placed beyond a zone's far edge, and targets expressed as multiples of initial risk. These concepts are public knowledge and belong to no single author.
My original contribution, and what this declaration covers, is the specific code implementation of those concepts: my own formulas, my own data structures, my own state-management architecture, my own filtering and locking logic, and my own visual and alert design. Conceptual overlap with other tools that also discuss Fair Value Gaps is therefore unavoidable and expected, but there is no source-code overlap of any kind.
Standard Pine Script built-in functions, and the drawing primitives box, line and label, are used only as low-level language facilities inside my own engine, in the same way any developer uses a programming language's standard library.
The full commented source, including both of these declarations, is contained in the script header.
━━━━━━━━━━━━━━━━━━━━━━━━━━━━━━━━━━━━━━━━━━━━━━━━━━━━━━━━━━━━━━━━━━━━━━━━━━
DISCLAIMER
This tool is for educational and informational purposes only. It does not constitute financial advice. Trading involves risk and past patterns do not guarantee future results. No signal produced by this indicator is a recommendation to enter or exit any position. Use proper risk management, test thoroughly on your own instruments and timeframes, and consult a licensed financial advisor before trading real capital. All trading decisions and all risk taken remain entirely your own responsibility.
tradingview.com/u/Forex_Market_Insights/
نص برمجي مفتوح المصدر
بروح TradingView الحقيقية، قام مبتكر هذا النص البرمجي بجعله مفتوح المصدر، بحيث يمكن للمتداولين مراجعة وظائفه والتحقق منها. شكرا للمؤلف! بينما يمكنك استخدامه مجانًا، تذكر أن إعادة نشر الكود يخضع لقواعد الموقع الخاصة بنا.

Join My VIP Free Signals Channel.✅
telegram.me/+ZNhfjlhXP3s4OWI1
For Daily LIVE Trades,
Join Free Telegram Channel ✅
telegram.me/+ZNhfjlhXP3s4OWI1
telegram.me/+ZNhfjlhXP3s4OWI1
For Daily LIVE Trades,
Join Free Telegram Channel ✅
telegram.me/+ZNhfjlhXP3s4OWI1
إخلاء المسؤولية
لا يُقصد بالمعلومات والمنشورات أن تكون، أو تشكل، أي نصيحة مالية أو استثمارية أو تجارية أو أنواع أخرى من النصائح أو التوصيات المقدمة أو المعتمدة من TradingView. اقرأ المزيد في شروط الاستخدام.
نص برمجي مفتوح المصدر
بروح TradingView الحقيقية، قام مبتكر هذا النص البرمجي بجعله مفتوح المصدر، بحيث يمكن للمتداولين مراجعة وظائفه والتحقق منها. شكرا للمؤلف! بينما يمكنك استخدامه مجانًا، تذكر أن إعادة نشر الكود يخضع لقواعد الموقع الخاصة بنا.
Join My VIP Free Signals Channel.✅
telegram.me/+ZNhfjlhXP3s4OWI1
For Daily LIVE Trades,
Join Free Telegram Channel ✅
telegram.me/+ZNhfjlhXP3s4OWI1
telegram.me/+ZNhfjlhXP3s4OWI1
For Daily LIVE Trades,
Join Free Telegram Channel ✅
telegram.me/+ZNhfjlhXP3s4OWI1
إخلاء المسؤولية
لا يُقصد بالمعلومات والمنشورات أن تكون، أو تشكل، أي نصيحة مالية أو استثمارية أو تجارية أو أنواع أخرى من النصائح أو التوصيات المقدمة أو المعتمدة من TradingView. اقرأ المزيد في شروط الاستخدام.