تم تحديثه
STRYK: MEAN REVERSIONS VWAP
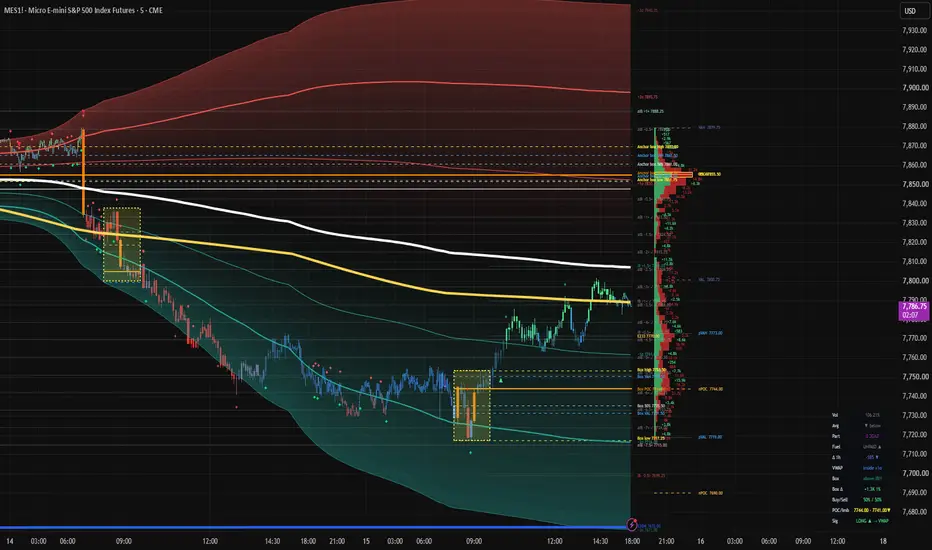
# STRYK: MEAN REVERSIONS VWAP (STRYK:MRV) v4.14
🔹 One VWAP indicator in place of five. A single VWAP ENGINE drives the line, three σ bands with a hyper-detailed gradient fill, the mean-reversion and break / reclaim signals, the VWAP candle colours and a side volume profile that always covers the same bars as the VWAP. Session levels, the opening box with extension targets, MDP candles and the 233 EMA with 20-week bands sit on the same chart, each with its own switch in the master section. Anything switched off is not drawn at all, so the chart stays light.
🔹 Eight anchors in one dropdown: rVWAP (rolling N candles of any timeframe, default 23 × 1 hour = one futures day, measured in elapsed clock time so it is the same window on every chart timeframe and across session breaks), Prev session 17:00, Prev-day 08:30, Weekday 08:30 (any weekday, N back), 2 weeks, Month, Prev month and 3 months. Lines can be drawn raw, stepped or with x8 double-pass smoothing (display only; signals always use the raw values). In a 2-year ES study (Oct 2024 – Oct 2026, 9 contracts, 5-minute bars, 2σ → 1σ rules, before costs) the rolling 23-hour VWAP led at +0.079R per trade over 698 trades, positive on 8 of 9 contracts. The edges are small; the built-in anchor test lets you check every anchor on your own chart, net of your own costs.
🔹 Signals read whichever engine you choose. Mean reversion: the original rule (touch band 2, close back inside band 1, target the VWAP) plus rule sets A and B, tested on all eight anchors at once. BREAK and RECLAIM at the VWAP and every band, graded by five gates (A acceptance, S size against same-time-of-day volume, F candle delta flow, P higher-timeframe pressure, T trend) with a gates-needed setting and confirmation bars. CE reversion triangles on the same engine. Marks are small text glyphs with their own shape, size and colour section, so they go smaller than TradingView's "tiny".
🔹 Anchor test table, net of costs: every row shows trades, win %, net R, R per trade, profit factor, max drawdown in R and the exit split (target / stop / timeout) after a cost-per-trade setting in ticks, with a low-sample flag under 30 trades. The same rules and the same costs apply to every anchor, so the ranking is a fair one.
🔹 Side profile: one centre axis, every bar grows to the right. Volume, Buy vs sell (green buying then red selling on one bar) or Delta, built from chart bars or intrabar tick data that scales with the chart timeframe. Row tags show delta, buy / sell, both, or imbalanced rows only (your × ratio, ▲ / ▼ marks, other rows dimmed). The POC, VAH and VAL of the engine window, the prior session's VAH / VAL and the naked POCs all draw across the profile with price tags at its right end, never across the candles. Gap and length from the last candle are adjustable.
🔹 Opening box: the 08:30–09:30 range with its 50 %, POC and value area, extension targets from 0.5× to 10× revealed one at a time as price reaches them, each with its own toggle, and the anchor box (previous day) with its own extend switches. Candle engines: σ distance, price vs VWAP, 3-state bands, VWAP reversion, Delta size HTF, Delta % and Fuel × Δ; Max Delta Print candles paint over any of them.
🔹 Clean chart: every line tag goes through one placer that sorts them and pushes them apart so nothing overlaps, in short-hand right next to the line ends, with a distance and gap setting. One section holds every line's colour, width and style; one section holds every signal's shape, size and colour with a legend of what each mark means. Every setting has a plain-English tooltip. Decisions are made on confirmed bars and nothing repaints. Replay mode keeps Bar Replay smooth. No performance claim is made or implied; not financial advice.
🔹 One VWAP indicator in place of five. A single VWAP ENGINE drives the line, three σ bands with a hyper-detailed gradient fill, the mean-reversion and break / reclaim signals, the VWAP candle colours and a side volume profile that always covers the same bars as the VWAP. Session levels, the opening box with extension targets, MDP candles and the 233 EMA with 20-week bands sit on the same chart, each with its own switch in the master section. Anything switched off is not drawn at all, so the chart stays light.
🔹 Eight anchors in one dropdown: rVWAP (rolling N candles of any timeframe, default 23 × 1 hour = one futures day, measured in elapsed clock time so it is the same window on every chart timeframe and across session breaks), Prev session 17:00, Prev-day 08:30, Weekday 08:30 (any weekday, N back), 2 weeks, Month, Prev month and 3 months. Lines can be drawn raw, stepped or with x8 double-pass smoothing (display only; signals always use the raw values). In a 2-year ES study (Oct 2024 – Oct 2026, 9 contracts, 5-minute bars, 2σ → 1σ rules, before costs) the rolling 23-hour VWAP led at +0.079R per trade over 698 trades, positive on 8 of 9 contracts. The edges are small; the built-in anchor test lets you check every anchor on your own chart, net of your own costs.
🔹 Signals read whichever engine you choose. Mean reversion: the original rule (touch band 2, close back inside band 1, target the VWAP) plus rule sets A and B, tested on all eight anchors at once. BREAK and RECLAIM at the VWAP and every band, graded by five gates (A acceptance, S size against same-time-of-day volume, F candle delta flow, P higher-timeframe pressure, T trend) with a gates-needed setting and confirmation bars. CE reversion triangles on the same engine. Marks are small text glyphs with their own shape, size and colour section, so they go smaller than TradingView's "tiny".
🔹 Anchor test table, net of costs: every row shows trades, win %, net R, R per trade, profit factor, max drawdown in R and the exit split (target / stop / timeout) after a cost-per-trade setting in ticks, with a low-sample flag under 30 trades. The same rules and the same costs apply to every anchor, so the ranking is a fair one.
🔹 Side profile: one centre axis, every bar grows to the right. Volume, Buy vs sell (green buying then red selling on one bar) or Delta, built from chart bars or intrabar tick data that scales with the chart timeframe. Row tags show delta, buy / sell, both, or imbalanced rows only (your × ratio, ▲ / ▼ marks, other rows dimmed). The POC, VAH and VAL of the engine window, the prior session's VAH / VAL and the naked POCs all draw across the profile with price tags at its right end, never across the candles. Gap and length from the last candle are adjustable.
🔹 Opening box: the 08:30–09:30 range with its 50 %, POC and value area, extension targets from 0.5× to 10× revealed one at a time as price reaches them, each with its own toggle, and the anchor box (previous day) with its own extend switches. Candle engines: σ distance, price vs VWAP, 3-state bands, VWAP reversion, Delta size HTF, Delta % and Fuel × Δ; Max Delta Print candles paint over any of them.
🔹 Clean chart: every line tag goes through one placer that sorts them and pushes them apart so nothing overlaps, in short-hand right next to the line ends, with a distance and gap setting. One section holds every line's colour, width and style; one section holds every signal's shape, size and colour with a legend of what each mark means. Every setting has a plain-English tooltip. Decisions are made on confirmed bars and nothing repaints. Replay mode keeps Bar Replay smooth. No performance claim is made or implied; not financial advice.
ملاحظات الأخبار
mobile friendly updateملاحظات الأخبار
updated speed and simplify ملاحظات الأخبار
added current todays 8:30 open engine
إخلاء المسؤولية
لا يُقصد بالمعلومات والمنشورات أن تكون، أو تشكل، أي نصيحة مالية أو استثمارية أو تجارية أو أنواع أخرى من النصائح أو التوصيات المقدمة أو المعتمدة من TradingView. اقرأ المزيد في شروط الاستخدام.
إخلاء المسؤولية
لا يُقصد بالمعلومات والمنشورات أن تكون، أو تشكل، أي نصيحة مالية أو استثمارية أو تجارية أو أنواع أخرى من النصائح أو التوصيات المقدمة أو المعتمدة من TradingView. اقرأ المزيد في شروط الاستخدام.