تم تحديثه
Altcoin Season Composite Oscillator
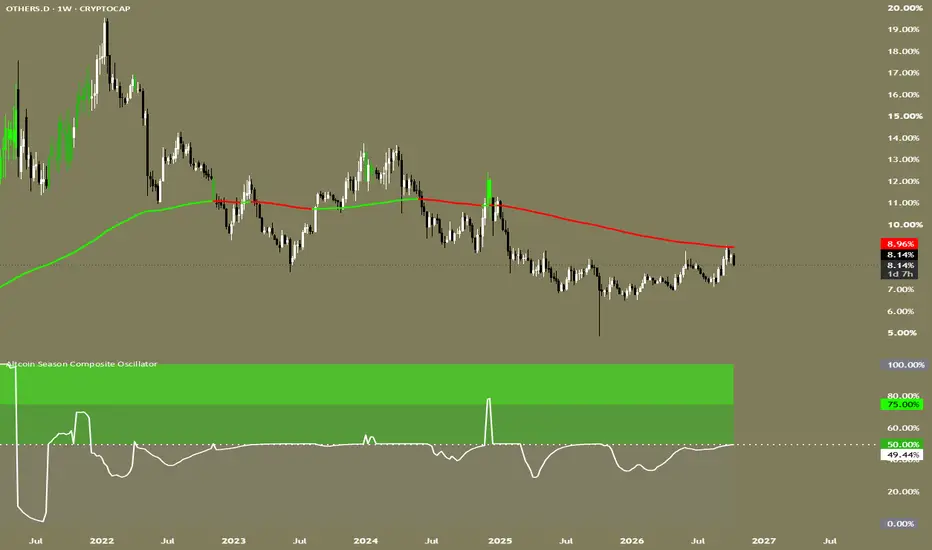
WHAT THIS INDICATOR DOES
The Altcoin Season Composite Oscillator is a macro, weekly-timeframe tool built for one specific chart: CRYPTOCAP:OTHERS.D, the aggregated market-cap dominance of every altcoin that is not among the ten largest cryptocurrencies by market capitalization. Its purpose is narrow and deliberate: to help you recognize, in a structured and repeatable way, when the broad altcoin market is genuinely entering a period of outperformance relative to Bitcoin and the largest-cap coins, as opposed to simply bouncing within a longer Bitcoin-led or sideways regime.
Rather than relying on a single moving average crossover or a single oscillator reading, the script evaluates three independent conditions on Bitcoin and on Bitcoin's dominance before it will ever display a bullish reading for altcoins. Those three conditions are described in full below. When all three align, the indicator reports a "Bullish" state; when Bitcoin is additionally trading at a statistically extreme extension above its own long-term baseline while those same three conditions hold, it reports an "Extreme Bullish" state. When any one of the three conditions fails, the indicator reports "No-Signal," which is a neutral, non-directional state rather than a bearish call — this script does not attempt to call altcoin downturns or BTC-season reversals; it is intentionally long-only and narrowly scoped to identifying the onset and persistence of altcoin outperformance conditions.
The output is presented in two complementary ways on the same chart setup: a 0–100 oscillator plotted in its own pane below the price chart, and a set of color-coded weekly candles overlaid directly on your OTHERS.D chart, so you can see exactly which weekly candles historically corresponded to each state. A third visual layer, an optional slope-filtered moving average, is plotted on the main chart as well, so you can see at a glance why the "slope gate" (explained below) is open or closed at any given time.
THE PROBLEM THIS SCRIPT IS TRYING TO SOLVE
Anyone who has traded or invested in the cryptocurrency market through more than one cycle has encountered the same repeating pattern: Bitcoin leads a bull market higher, gradually "using up" momentum, and at some point capital that was sitting in Bitcoin starts rotating into altcoins, which then outperform Bitcoin by a wide margin for a period of weeks or months before mean-reverting or being crushed in the next drawdown. This rotation is often called "altcoin season" informally, and plenty of simple heuristics exist to try to time it — watching BTC dominance fall, watching a handful of large-cap alts breakout, watching social sentiment, and so on.
The difficulty with most of these heuristics is that they react to a single variable in isolation. BTC dominance can fall for reasons that have nothing to do with genuine broad-based altcoin strength (for example, a single large-cap alt rallying hard while the rest of the market stays flat, or Bitcoin itself simply correcting faster than altcoins without altcoins actually gaining real strength). Conversely, Bitcoin can be in a strong uptrend while dominance still declines gently as new capital broadly diffuses into the asset class. Relying on any single variable, whether it is price action, dominance, or a generic trend filter, tends to produce either too many false starts or signals that arrive too late to be useful.
This script's approach is to require confirmation from three structurally different angles simultaneously — Bitcoin's own price trend relative to its historical baseline, the directional trend of Bitcoin's dominance specifically, and a separate, independently configurable long-term slope filter — before it will register a bullish reading. The logic is that true altcoin-season conditions are a confluence event: Bitcoin needs to be healthy enough that the broader market has capital to redistribute, dominance needs to actually be declining (meaning that redistribution is happening in practice, not just in theory), and the medium/long-term trend of the chosen reference needs to be constructive rather than deteriorating. Requiring all three to align at once is a deliberate design decision to reduce false signals at the cost of being somewhat slower to flip from "No-Signal" to "Bullish" than a single-variable approach would be. That is a trade-off, and it is the trade-off this script is built around: fewer, more structurally sound signals rather than a higher frequency of noisy ones.
WHY THE INDICATOR IS RESTRICTED TO OTHERS.D ON THE WEEKLY TIMEFRAME
This script locks itself to a single symbol, CRYPTOCAP:OTHERS.D, and a single timeframe, Weekly. This is not an arbitrary restriction, and it is worth explaining plainly rather than leaving it as a black box, since the script will show a warning box instead of plotting anything if you have the wrong chart open.
OTHERS.D measures the combined market capitalization of every coin outside the ten largest, expressed as a percentage of the total crypto market capitalization. This is, definitionally, the most direct available proxy for "the broad altcoin market's share of all capital in crypto." If the goal is to detect genuine altcoin-season conditions across the market as a whole, rather than the performance of any single coin or narrow basket, this is the correct chart to be looking at; an individual altcoin's chart, or even BTC.D viewed alone, cannot substitute for it, because either can move for idiosyncratic reasons that are unrelated to the broad rotation this script is designed to detect. The candles you see colored on your chart, and the oscillator plotted below, are describing conditions that are meant to be read in the context of this specific dominance metric.
The Weekly restriction exists for a different but related reason: noise reduction. Dominance rotation between Bitcoin and the altcoin market as a whole is a slow-moving, multi-week to multi-month phenomenon. It is the kind of structural shift that plays out over a market cycle, not over a single trading session. On lower timeframes, dominance data is affected by exchange-specific volume anomalies, temporary liquidity gaps, and intraday noise that can make a dominance chart look like it is trending when it is simply oscillating randomly within a larger, unchanged structure. The Weekly candle close is, in the view encoded into this script, the lowest timeframe at which dominance trend signals remain statistically meaningful rather than noise, while still being granular enough to be useful for position-level decision-making (as opposed to, say, Monthly, which would be too slow to be actionable for most users). If you load this script on any other symbol or any timeframe other than Weekly, it will not silently produce a misleading value — it will display a plain-language warning box in the top-right corner of your chart telling you exactly which setting to correct, and it will not plot the oscillator, the candle overlay, or the slope line until you do. Nothing is hidden or approximated in the background; the script simply declines to display anything until it is being used in the environment it was built for.
THE THREE-GATE STATE MACHINE, EXPLAINED IN DETAIL
The heart of this script is a simple three-condition gate. All three gates must be satisfied simultaneously for a bullish reading of any kind to be produced. None of the three gates "overrides" or compensates for the others; they are evaluated with a strict logical AND.
Gate one: Bitcoin is "armed." This gate asks a single question: is Bitcoin's current weekly close above its own short/medium-term simple moving average (the "BTC Price Arming SMA," default length 20 weeks)? This is the most basic trend-health check in the script, and it exists because altcoin outperformance historically tends not to occur while Bitcoin itself is in an established downtrend. When Bitcoin is below its own 20-week SMA, capital in the market as a whole tends to be de-risking rather than redistributing, and altcoins in that environment are far more likely to be falling alongside or faster than Bitcoin rather than outperforming it. "Armed" simply means Bitcoin has cleared this basic trend-health bar; it does not by itself mean a signal will fire, since the other two gates still need to be satisfied.
Gate two: dominance confirmation. This gate checks whether the Dominance Symbol you have selected (BTC.D by default) has its weekly close below its own EMA (the "Dominance EMA," default length 20 weeks). If Bitcoin's dominance is trending down relative to its own recent average, this is read as direct, measurable evidence that capital share is moving away from Bitcoin and, by extension, toward the rest of the market. This gate is what separates "Bitcoin is going up" (which can happen while Bitcoin's dominance simultaneously rises, meaning altcoins are being left behind) from "Bitcoin is going up and losing market share at the same time" (which is a materially different, and more altcoin-favorable, condition). You can switch the Dominance Symbol input to OTHERS.D directly if you prefer to measure the altcoin basket's own dominance uptrend rather than inferring it from Bitcoin's dominance downtrend; both are valid framings of the same underlying rotation, and the choice is left to you.
A historical caveat applies here: market-cap dominance series were not tracked by data providers before roughly 2017–2018. For any weekly bar before dominance data exists, the script cannot evaluate gate two directly. The "Enable Pre-2018 Dominance Fallback" input controls what happens in that case. With the fallback enabled (the default), bars with no available dominance data are treated as though gate two were satisfied, so that gates one and three can still produce a meaningful signal on that early history, purely for the purpose of backtesting visual context. With the fallback disabled, those same early bars are instead treated as "not confirmed," meaning the whole gate fails and those bars will show as No-Signal. Neither setting affects any bar from 2018 onward, where real dominance data is always used.
Gate three: the slope filter. This is a fully separate, independently configurable long-term moving average (default: a 200-week EMA of close), whose own week-over-week percentage rate of change is checked against a minimum threshold (default 0.0%, meaning the average must simply be flat-to-rising, not falling). If this slope value is at or above the threshold, the gate is open; if the slope is negative (or below whatever threshold you set), the gate is closed and no bullish signal of any kind can be produced, regardless of what gates one and two are doing. This is the slowest-moving of the three gates by design — at a 200-week length, it is meant to represent the dominant, multi-year trend regime, functioning as a macro "cycle filter" that prevents the faster-moving gates one and two from producing a bullish signal during a broader macro downtrend or distribution phase. You can shorten this length, change its moving-average type (SMA, EMA, WMA, RMA, or VWMA), change its source, or raise its required threshold above zero to make this gate stricter and more selective; all of these are exposed as inputs specifically so the gate's sensitivity can be tuned to your own view of what "macro uptrend" should mean, rather than being fixed to a single hard-coded definition.
THE DIFFERENCE BETWEEN "BULLISH" AND "EXTREME BULLISH"
When all three gates are open, the script does not treat every bullish reading identically. It adds a fourth check specifically to Bitcoin's own price: is Bitcoin's weekly close at or above its own upper Bollinger Band, calculated with a 200-week SMA basis and a 3.0 standard-deviation multiplier by default? This band represents a statistically wide extension above Bitcoin's own long-term mean. When Bitcoin is trading at or beyond this level while the other three gates are also satisfied, the indicator reports "Extreme Bullish" rather than plain "Bullish."
The reasoning here is historical and structural: in past cycles, some of the sharpest and fastest periods of altcoin outperformance have coincided with Bitcoin itself reaching extreme, euphoric price extensions — the point at which Bitcoin's own upside becomes statistically stretched tends to be exactly when speculative capital starts chasing returns further out on the risk curve, into altcoins, in search of larger percentage moves. "Extreme Bullish," in other words, is not a separate signal built on different logic; it is the same three-gate Bullish condition, with an additional flag raised specifically when Bitcoin's own price action suggests that this capital-rotation dynamic may be particularly pronounced. You can adjust how "extreme" needs to be defined by changing the Bollinger Band length and standard-deviation multiplier in the Core Data Sources group; a lower multiplier will flag the Extreme Bullish state more readily, a higher multiplier will reserve it for rarer, more stretched conditions.
READING THE OSCILLATOR
The oscillator is scaled from 0 to 100 and divided into three visually shaded zones that directly mirror the state machine: 75–100 is the Extreme Bullish zone, 50–75 is the Bullish zone, and 0–50 is the No-Signal zone. The oscillator's position within whichever zone is currently active is not arbitrary — it is calculated from Bitcoin's actual distance from the relevant moving average or band, normalized against the span between the arming SMA and the Bollinger extreme. In plain terms, when in the Bullish zone, the oscillator moves higher within that zone the further Bitcoin's price sits above its own arming SMA; when in the Extreme Bullish zone, it moves higher within that zone the further Bitcoin trades beyond its own Bollinger extreme; and when in the No-Signal zone, it moves lower the further Bitcoin's price sits below its arming SMA. This means the oscillator is not just a flat three-level step function — it carries continuous information about the degree of conviction behind the current state, not only which state is active. A horizontal price line marks the oscillator's current value directly on the pane's price scale by default, so its latest reading is always visible at a glance.
To prevent this position-within-zone value from jumping around erratically bar to bar, it is passed through an exponential smoothing function, whose responsiveness you control with the "Oscillator Responsiveness" input (default 9). Raising this value makes the line move more smoothly and gradually within its zone; lowering it makes the line track the raw underlying value more tightly and reactively. Critically, this smoothing never delays or blurs a transition between zones — the moment the underlying state changes (from No-Signal to Bullish, for example), the smoothing resets instantly so the line snaps immediately to the new zone rather than gradually drifting into it. This was a specific design choice to avoid any ambiguity about exactly which bar a state change occurred on; the smoothing purely affects how the value behaves once inside a stable state, never the timing of a transition.
READING THE CANDLE OVERLAY
Independently of the oscillator pane, the script can overlay color-coded candles directly on your main OTHERS.D price chart (toggle: "Show Signal-Colored Candles on Main Chart"). Each weekly candle is colored according to the state that was active during that candle: a brighter green for Extreme Bullish, a slightly muted green for plain Bullish, and, when no signal is active, a neutral color that simply reflects whether that candle closed up or down (white for up, black for down, both independently configurable in the Neutral Candle Colors group). These neutral colors carry no directional meaning of their own — they exist purely so that a No-Signal week is still visually legible as an up or down week on your chart, without implying any kind of sell or short signal. This script does not produce bearish or short signals of any kind; the absence of a green candle simply means the bullish confluence conditions were not met on that bar.
THE SLOPE MOVING AVERAGE OVERLAY
Separately from the candle coloring, the script can plot the slope-filter moving average (gate three, described above) directly on your main chart as a colored line (toggle: "Show Slope MA on Main Chart"). The line's color itself reflects whether the slope gate is currently open (using the "Slope MA Up Color" input) or closed (using the "Slope MA Down Color" input). This gives you an immediate visual reference for the macro trend regime that is currently permitting or blocking signals, without needing to check the oscillator pane or do any mental math — if the line on your main chart is red, you already know no Bullish or Extreme Bullish reading is currently possible, no matter what Bitcoin's price or dominance are doing individually.
NON-REPAINTING DESIGN AND WHAT "WAIT FOR CANDLE CLOSE" MEANS HERE
All three of Bitcoin's weekly data points (its close, its arming SMA, and its Bollinger extreme) and both of the dominance series' weekly data points (its close and its EMA) are fetched using TradingView's higher-timeframe data request mechanism. With "Non-Repainting Mode" enabled (the default and recommended setting), every one of these values is deliberately pulled from the prior, fully confirmed weekly bar rather than the currently forming one. In practical terms, this means that once a weekly candle has closed and the indicator has displayed a state for it, that state is final — it will never change retroactively, and it will never have shown you a different, "preview" value while that candle was still forming. This is what is meant by "non-repainting with wait for candle close": the script does not evaluate or act on incomplete data.
If you disable Non-Repainting Mode, the script instead evaluates all of the same conditions using live, intrabar values from the currently forming weekly candle. This can be useful if you specifically want an early read on how the current week is shaping up relative to the gates, but you should understand explicitly that in this mode, the state shown for the current, still-forming week can and will change as the week progresses and new price action comes in, right up until the candle actually closes. Every fully closed historical bar behaves identically in both modes; the distinction only ever affects the single most recent, currently forming bar.
ALERTS
Six distinct alert conditions are built into the script, all of which can be set up through TradingView's standard "Create Alert" dialog by selecting this indicator and choosing the relevant condition from the dropdown: Extreme Bullish State Entered, Bullish State Entered, No-Signal State Entered, BTC Armed – Awaiting Dominance Confirmation, Dominance Confirming – Awaiting BTC Arming, and Any Signal State Change (a catch-all that fires whenever any of the three primary states first becomes active). The two "awaiting" alerts are intentionally included as early-warning conditions: they fire when exactly one of the first two gates has opened but the other has not yet followed, which can give you advance notice that a full Bullish condition may be close to forming, without pre-empting or front-running the actual confirmed signal. Internally, every alert is gated so that it can only fire on a fully confirmed weekly bar close (never intrabar, regardless of your Non-Repainting Mode setting for the plotted values), ensuring that alerts and chart states always correspond to the same, final, non-repainting data.
WALKING THROUGH THE SETTINGS
The Core Data Sources group lets you choose the Bitcoin price symbol (an aggregated index by default, to avoid single-exchange artifacts), the dominance symbol used for gate two, the arming SMA length for gate one, and the Bollinger Band length and multiplier that define the Extreme Bullish threshold on Bitcoin's own price. The Historical Compatibility group contains a single toggle controlling how the script treats weekly bars that predate the existence of dominance data, relevant only if you scroll your chart back before roughly 2017–2018. The Repainting Control group contains the single most important setting for signal reliability: whether higher-timeframe values are taken from confirmed closes only (recommended) or updated live intrabar. The Display group controls the oscillator's internal smoothing responsiveness and whether the signal-colored candle overlay is shown on your main chart. The Neutral Candle Colors group lets you choose the up/down colors used only for candles where no bullish signal is active, purely for chart readability. The Slope Moving Average group exposes full control over gate three: its type, length, source, minimum slope threshold, whether it is plotted on your main chart, and its up/down coloring. Finally, the Symbol & Timeframe Lock group contains one toggle that controls whether the on-chart restriction warning is displayed when the wrong symbol or timeframe is loaded; its tooltip explains in full why the OTHERS.D and Weekly requirements exist, as covered above.
HOW TO USE THIS IN PRACTICE
In practical terms, this script is meant to be checked periodically — weekly, in line with its native timeframe — as part of a broader portfolio allocation process, not watched tick by tick. A transition from No-Signal to Bullish, confirmed on a closed weekly candle, is the indicator telling you that all three of its structural conditions (Bitcoin's own trend health, Bitcoin's dominance trend, and the long-term macro slope filter) have aligned in a way that has historically coincided with periods of altcoin outperformance. A subsequent transition into Extreme Bullish adds the additional observation that Bitcoin itself has become statistically stretched to the upside while those same three conditions remain satisfied, which in past cycles has often (though not always) coincided with the more explosive phases of altcoin performance. A transition back to No-Signal, at any point, simply means that one or more of the three gates has failed again — it is not a bearish or exit signal in the way a short indicator would be, and it should be read as "the structural case for altcoin outperformance is no longer confirmed," not as "altcoins are now going to fall."
WHAT MAKES THIS ORIGINAL
This script is not a reskin, recombination, or derivative of any other published open-source or closed-source script, nor does it reuse any third-party code, formulas, or logic. Every function, gate, and the oscillator's zone-mapping and smoothing behavior were written specifically for this release. Its originality lies specifically in the combination of three structurally independent, simultaneously-required filters (a short/medium-term Bitcoin price trend filter, a dominance-trend confirmation filter measured on a separate, user-selectable symbol, and a long-term, independently configurable slope filter) compressed into a single continuous 0–100 oscillator whose position within each zone carries proportional information about the strength of the current reading, synchronized one-to-one with a dedicated candle-coloring overlay and a transparent, symbol-and-timeframe-aware non-repainting data pipeline. No part of this design reproduces any single widely known indicator (such as RSI, a standard Bollinger Band breakout script, or a simple dominance crossover) in isolation; it is the specific combination, gating logic, and presentation that constitute the original contribution here.
LIMITATIONS AND DISCLAIMER
This indicator does not predict the future, does not constitute financial advice, and should not be used as a standalone basis for any trading or investment decision. Its signals reflect historically observed structural relationships between Bitcoin's price trend, Bitcoin's dominance trend, and a long-term macro slope filter; these relationships can change, weaken, or stop working altogether as market structure evolves, and no combination of the gates described above guarantees that a given Bullish or Extreme Bullish reading will be followed by actual altcoin outperformance. The indicator is long-only and does not provide exit signals, stop-loss guidance, position sizing, or any assessment of individual altcoin selection; it addresses only the broad, aggregate question of whether structural conditions for altcoin outperformance, as defined by its three gates, are currently present across the market as a whole. Past confluence between these gates and historical altcoin-season periods is not a guarantee of future results. Users remain fully responsible for their own research, risk management, and trading decisions.
SUITABLE MARKETS, TIMEFRAME, AND TRADING STYLE
By design and by hard restriction, this indicator functions on exactly one market and one timeframe: CRYPTOCAP:OTHERS.D on the Weekly chart. It is not intended for, and will not function on, other asset classes (equities, forex, commodities), individual altcoin charts, or any timeframe other than Weekly. Within that scope, it is built for a positional, macro-allocation style of use — the kind of decision-making relevant to investors or portfolio managers deciding how much of a crypto allocation should be weighted toward Bitcoin versus a broader altcoin basket over a multi-week to multi-month horizon. It is not designed for, and is unsuitable for, intraday trading, scalping, or any strategy requiring frequent, fast signals, since its entire logic is deliberately built around slow-moving, multi-week structural confirmation rather than short-term price action.
ملاحظات الأخبار
Update note (Symbol & Timeframe selection):This version replaces the previous hard lock to CRYPTOCAP:OTHERS.D / Weekly with two selectable inputs in the "Symbol & Timeframe Lock" group. You can now choose the required symbol between OTHERS (default, the aggregate market cap value of the broad altcoin basket) and OTHERS.D (its dominance %), and the required timeframe between 1D, 2D, 3D, 4D, 5D, 6D, 1W (default), 2W, 3W, and 1M. The indicator still only plots and alerts when your live chart's symbol and timeframe exactly match whatever you've selected in these two inputs — everything else (the three-gate logic, the oscillator, the candle overlay, the slope filter, and the non-repainting data pipeline) is unchanged. This simply gives you control over which basket and which structural lookback horizon the "altcoin season" confluence is measured on, instead of forcing one fixed combination.

إخلاء المسؤولية
لا يُقصد بالمعلومات والمنشورات أن تكون، أو تشكل، أي نصيحة مالية أو استثمارية أو تجارية أو أنواع أخرى من النصائح أو التوصيات المقدمة أو المعتمدة من TradingView. اقرأ المزيد في شروط الاستخدام.
إخلاء المسؤولية
لا يُقصد بالمعلومات والمنشورات أن تكون، أو تشكل، أي نصيحة مالية أو استثمارية أو تجارية أو أنواع أخرى من النصائح أو التوصيات المقدمة أو المعتمدة من TradingView. اقرأ المزيد في شروط الاستخدام.