تم تحديثه
TTG Brick Strategy Day Swing Mini Bricks
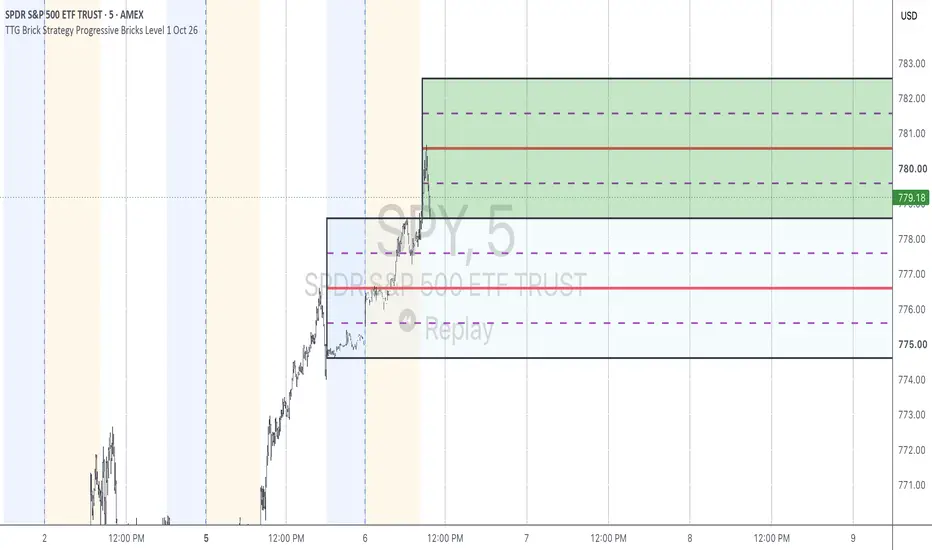
## TTG Brick Strategy — Dual Adjustable Dashed Levels
This updated **TTG Brick Strategy** adds two customizable internal levels to each brick, creating a clearer roadmap of how price is progressing through the Bull, Center, and Bear zones.
Each brick can now be divided into **four sections** rather than relying only on the traditional 50% midpoint.
For example, with the secondary level set to **25%**, each brick becomes:
**Brick Top**
**75% — Upper Dashed Line**
**50% — Main Midline**
**25% — Lower Dashed Line**
**Brick Bottom**
### Three Internal Price Levels
**Main Midline — 50%**
The original solid midline remains the center of each brick.
**Lower Secondary Level — adjustable**
A dashed line that can be positioned anywhere within the lower half of the brick.
**Upper Secondary Level — mirrored**
A second dashed line on the upper side of the brick. It mirrors the lower setting. For example:
- 20% → upper line at 80%
- 25% → upper line at 75%
- 30% → upper line at 70%
- 40% → upper line at 60%
This creates symmetrical internal price zones.
### Independent Toggles
The secondary levels can be controlled independently:
**Show Secondary Dashed Line**
Turns the lower dashed level on/off.
**Show Upper Secondary Dashed Line**
Turns the upper mirrored level on/off.
This means you can display **both dashed levels, only the upper, only the lower, or neither** while keeping the original 50% midline.
### Applies to the Entire Brick System
The additional levels are incorporated into:
**Bull Bricks** — bullish expansion zones
**Center Bricks** — primary decision/range zones
**Bear Bricks** — bearish expansion zones
**Continuation Bricks** — additional bricks created as price expands
And they work across all four TTG structures:
**Overnight • RTH • Weekly • Monthly**
### How to Read It
Instead of seeing a brick as one large price area, you can now read price progression as:
**0% → 25% → 50% → 75% → 100%**
That can make it easier to see whether price is merely entering a brick, reaching equilibrium, or progressing toward the opposite boundary.
For a bullish move, for example:
**Brick Bottom → 25% → 50% → 75% → Brick Top**
gives you a structured way to monitor the move through the entire brick rather than treating the brick as a single zone.
This updated **TTG Brick Strategy** adds two customizable internal levels to each brick, creating a clearer roadmap of how price is progressing through the Bull, Center, and Bear zones.
Each brick can now be divided into **four sections** rather than relying only on the traditional 50% midpoint.
For example, with the secondary level set to **25%**, each brick becomes:
**Brick Top**
**75% — Upper Dashed Line**
**50% — Main Midline**
**25% — Lower Dashed Line**
**Brick Bottom**
### Three Internal Price Levels
**Main Midline — 50%**
The original solid midline remains the center of each brick.
**Lower Secondary Level — adjustable**
A dashed line that can be positioned anywhere within the lower half of the brick.
**Upper Secondary Level — mirrored**
A second dashed line on the upper side of the brick. It mirrors the lower setting. For example:
- 20% → upper line at 80%
- 25% → upper line at 75%
- 30% → upper line at 70%
- 40% → upper line at 60%
This creates symmetrical internal price zones.
### Independent Toggles
The secondary levels can be controlled independently:
**Show Secondary Dashed Line**
Turns the lower dashed level on/off.
**Show Upper Secondary Dashed Line**
Turns the upper mirrored level on/off.
This means you can display **both dashed levels, only the upper, only the lower, or neither** while keeping the original 50% midline.
### Applies to the Entire Brick System
The additional levels are incorporated into:
**Bull Bricks** — bullish expansion zones
**Center Bricks** — primary decision/range zones
**Bear Bricks** — bearish expansion zones
**Continuation Bricks** — additional bricks created as price expands
And they work across all four TTG structures:
**Overnight • RTH • Weekly • Monthly**
### How to Read It
Instead of seeing a brick as one large price area, you can now read price progression as:
**0% → 25% → 50% → 75% → 100%**
That can make it easier to see whether price is merely entering a brick, reaching equilibrium, or progressing toward the opposite boundary.
For a bullish move, for example:
**Brick Bottom → 25% → 50% → 75% → Brick Top**
gives you a structured way to monitor the move through the entire brick rather than treating the brick as a single zone.
ملاحظات الأخبار
# TTG Progressive Brick Strategy**Dynamic Price Action • Market Structure • Precision Entry & Exit Levels**
The **TTG Progressive Brick Strategy** is a TradingView indicator designed to identify key price levels, visualize market direction, and help traders recognize potential entries, exits, support, and resistance.
Unlike traditional indicators that display multiple projected levels simultaneously, TTG Progressive Bricks dynamically reveals new price zones as the market moves.
### How It Works
The indicator establishes an initial rectangle using the selected market range, including after-hours and premarket highs and lows, regular trading hours, previous weekly ranges, or previous monthly ranges.
This initial rectangle becomes the foundation for all subsequent price levels.
As price moves beyond the original range, new rectangles appear progressively when a completed candle opens and closes within the next qualifying price zone.
- **Blue Center Brick:** Represents the original reference range.
- **Green Bull Bricks:** Identify higher price zones as bullish movement develops.
- **Red Bear Bricks:** Identify lower price zones as bearish movement develops.
Every additional brick maintains the exact same price height as the original rectangle, creating consistent and measurable trading levels.
### Three Customizable Price Levels
Each rectangle contains three horizontal reference lines:
- **Upper Midline (75%):** Identifies an upper internal price level.
- **Center Midline (50%):** Represents the midpoint of the rectangle.
- **Lower Midline (25%):** Identifies a lower internal price level.
These levels can help traders identify potential price reactions, consolidation zones, momentum continuation, and areas for profit-taking.
All three lines feature customizable colors, thicknesses, and solid or dashed styles.
### Progressive Brick Activation
New rectangles are revealed only after price satisfies the qualifying candle conditions. This reduces unnecessary chart clutter and keeps attention on price zones that have actually been reached.
Each brick extends horizontally across the chart, allowing traders to monitor price interactions with its boundaries and internal levels.
### Key Features
- Dynamic bullish and bearish rectangles
- After-hours and premarket range tracking
- Regular trading session range option
- Previous weekly and monthly range options
- Equal-sized continuation bricks
- Three customizable horizontal levels per rectangle
- Adjustable rectangle colors and transparency
- Configurable number of continuation bricks
- Alerts for bullish, bearish, and center brick midlines
- Alerts for brick tops and bottoms
- Compatible with intraday chart timeframes
### Trading Applications
TTG Progressive Bricks can be used to support:
- Breakout and continuation trading
- Range-bound trading strategies
- Support and resistance identification
- Pullback and reversal analysis
- Scalping and intraday trading
- Swing trading
- Options entry and exit planning
**The TTG Progressive Brick Strategy transforms price movement into a structured series of actionable reference zones, helping traders follow market behavior without displaying unnecessary future rectangles.**
*Disclaimer: This indicator is an analytical tool, not a guarantee of future price direction or trading profitability. Traders should use appropriate risk management and independent confirmation before entering positions.*

إخلاء المسؤولية
لا يُقصد بالمعلومات والمنشورات أن تكون، أو تشكل، أي نصيحة مالية أو استثمارية أو تجارية أو أنواع أخرى من النصائح أو التوصيات المقدمة أو المعتمدة من TradingView. اقرأ المزيد في شروط الاستخدام.
إخلاء المسؤولية
لا يُقصد بالمعلومات والمنشورات أن تكون، أو تشكل، أي نصيحة مالية أو استثمارية أو تجارية أو أنواع أخرى من النصائح أو التوصيات المقدمة أو المعتمدة من TradingView. اقرأ المزيد في شروط الاستخدام.