Delta Pressure
Delta Pressure
A clean read on whether recent bars were bought or sold, with higher-timeframe context.
What it does
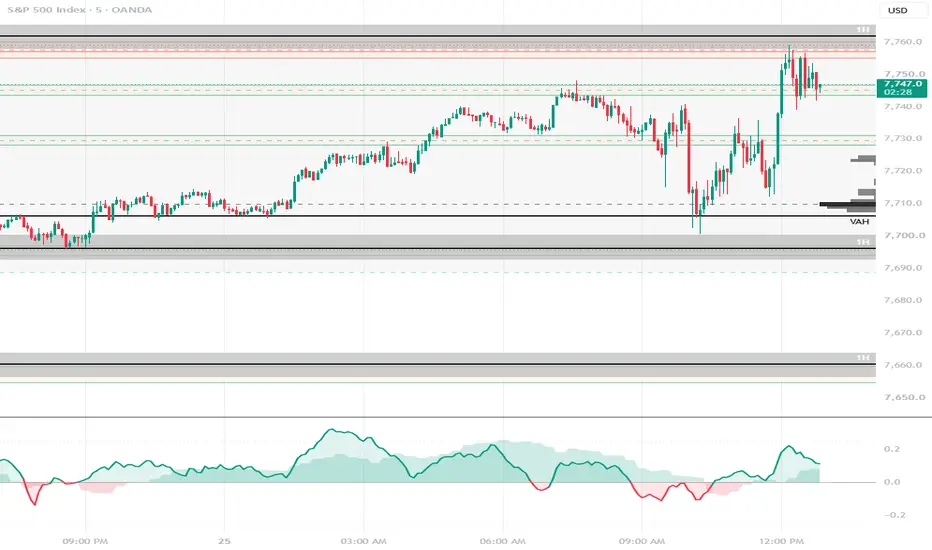
Each bar produces a pressure value from where it closed relative to where it opened, weighted by that bar's volume. The line is the volume-weighted average of the last N bars, so heavy bars count more than thin ones. The result is bounded between −1 and +1 and oscillates naturally around zero — no cumulation, no drift, no anchor.
Above zero, buyers controlled the recent tape. Below zero, sellers did. The dotted guides at ±0.25 mark where readings become one-sided enough to be worth noting.
Higher timeframe
An optional shaded layer shows the same calculation from a higher timeframe behind the main line. When both sit on the same side of zero, pressure agrees across timeframes. When they split, your chart timeframe is fighting the larger one. The HTF layer updates only on confirmed bars by default, so it steps rather than repainting — you can switch that off for a smoother look if you prefer live values.
Settings worth knowing
Method — Body compares close to open and ignores wicks. Close Position measures where the close sits within the full range.
Body tends to read cleaner on futures, since a long rejection wick shouldn't count as participation.
Length — bars averaged. Shorter reacts faster and noisier.
Timeframe — on a 5-minute chart, 15 or 30 works well.
Style — line, histogram, or both.
What it is not
This is a proxy, not true order-flow delta. Real delta requires tick-by-tick bid/ask data that Pine cannot access. Where a bar closes is a reasonable stand-in for who won it, but it will misread gap bars and very thin bars. Treat it as a pressure estimate.
There are no buy or sell signals here, deliberately. It's a context tool — meant to sit under whatever setup you already trade and tell you whether participation is backing the move.
A clean read on whether recent bars were bought or sold, with higher-timeframe context.
What it does
Each bar produces a pressure value from where it closed relative to where it opened, weighted by that bar's volume. The line is the volume-weighted average of the last N bars, so heavy bars count more than thin ones. The result is bounded between −1 and +1 and oscillates naturally around zero — no cumulation, no drift, no anchor.
Above zero, buyers controlled the recent tape. Below zero, sellers did. The dotted guides at ±0.25 mark where readings become one-sided enough to be worth noting.
Higher timeframe
An optional shaded layer shows the same calculation from a higher timeframe behind the main line. When both sit on the same side of zero, pressure agrees across timeframes. When they split, your chart timeframe is fighting the larger one. The HTF layer updates only on confirmed bars by default, so it steps rather than repainting — you can switch that off for a smoother look if you prefer live values.
Settings worth knowing
Method — Body compares close to open and ignores wicks. Close Position measures where the close sits within the full range.
Body tends to read cleaner on futures, since a long rejection wick shouldn't count as participation.
Length — bars averaged. Shorter reacts faster and noisier.
Timeframe — on a 5-minute chart, 15 or 30 works well.
Style — line, histogram, or both.
What it is not
This is a proxy, not true order-flow delta. Real delta requires tick-by-tick bid/ask data that Pine cannot access. Where a bar closes is a reasonable stand-in for who won it, but it will misread gap bars and very thin bars. Treat it as a pressure estimate.
There are no buy or sell signals here, deliberately. It's a context tool — meant to sit under whatever setup you already trade and tell you whether participation is backing the move.

إخلاء المسؤولية
لا يُقصد بالمعلومات والمنشورات أن تكون، أو تشكل، أي نصيحة مالية أو استثمارية أو تجارية أو أنواع أخرى من النصائح أو التوصيات المقدمة أو المعتمدة من TradingView. اقرأ المزيد في شروط الاستخدام.
إخلاء المسؤولية
لا يُقصد بالمعلومات والمنشورات أن تكون، أو تشكل، أي نصيحة مالية أو استثمارية أو تجارية أو أنواع أخرى من النصائح أو التوصيات المقدمة أو المعتمدة من TradingView. اقرأ المزيد في شروط الاستخدام.