OPEN-SOURCE SCRIPT
CVD Oscillator (BEST)
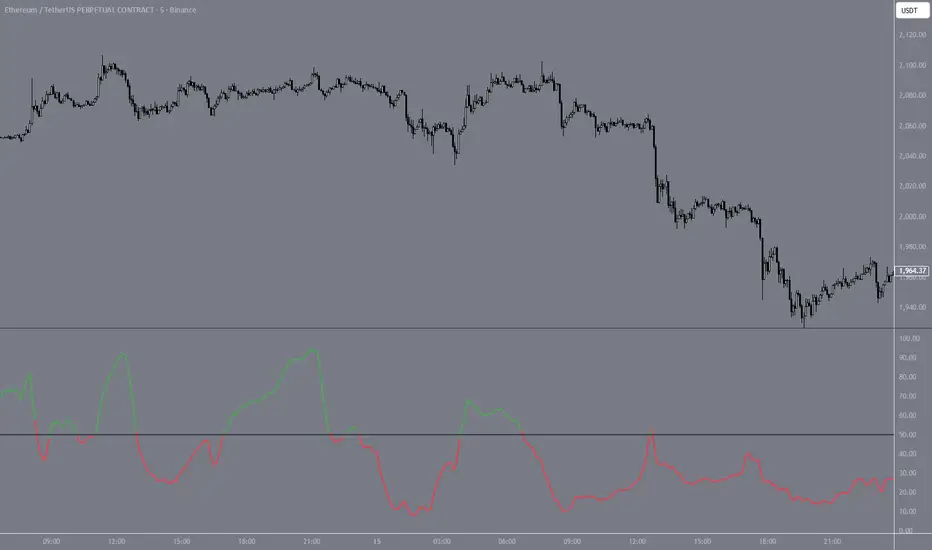
Estimates Cumulative Volume Delta from OHLCV candle data and normalizes it to a 0-100 scale. Approximates order flow without tick-level data by measuring where each candle closes within its range, weighted by volume — closes near the high register as buying pressure, closes near the low as selling pressure.
The raw CVD is normalized over a rolling lookback window and smoothed with an EMA. Readings above 50 indicate buyers dominating relative to recent history, below 50 indicates sellers. Useful for spotting divergences between price and volume flow — e.g. price making new highs while the oscillator declines suggests weakening buyer conviction.
The raw CVD is normalized over a rolling lookback window and smoothed with an EMA. Readings above 50 indicate buyers dominating relative to recent history, below 50 indicates sellers. Useful for spotting divergences between price and volume flow — e.g. price making new highs while the oscillator declines suggests weakening buyer conviction.
نص برمجي مفتوح المصدر
بروح TradingView الحقيقية، قام مبتكر هذا النص البرمجي بجعله مفتوح المصدر، بحيث يمكن للمتداولين مراجعة وظائفه والتحقق منها. شكرا للمؤلف! بينما يمكنك استخدامه مجانًا، تذكر أن إعادة نشر الكود يخضع لقواعد الموقع الخاصة بنا.

إخلاء المسؤولية
لا يُقصد بالمعلومات والمنشورات أن تكون، أو تشكل، أي نصيحة مالية أو استثمارية أو تجارية أو أنواع أخرى من النصائح أو التوصيات المقدمة أو المعتمدة من TradingView. اقرأ المزيد في شروط الاستخدام.
نص برمجي مفتوح المصدر
بروح TradingView الحقيقية، قام مبتكر هذا النص البرمجي بجعله مفتوح المصدر، بحيث يمكن للمتداولين مراجعة وظائفه والتحقق منها. شكرا للمؤلف! بينما يمكنك استخدامه مجانًا، تذكر أن إعادة نشر الكود يخضع لقواعد الموقع الخاصة بنا.
إخلاء المسؤولية
لا يُقصد بالمعلومات والمنشورات أن تكون، أو تشكل، أي نصيحة مالية أو استثمارية أو تجارية أو أنواع أخرى من النصائح أو التوصيات المقدمة أو المعتمدة من TradingView. اقرأ المزيد في شروط الاستخدام.