OPEN-SOURCE SCRIPT
K-NN Pattern Forecast
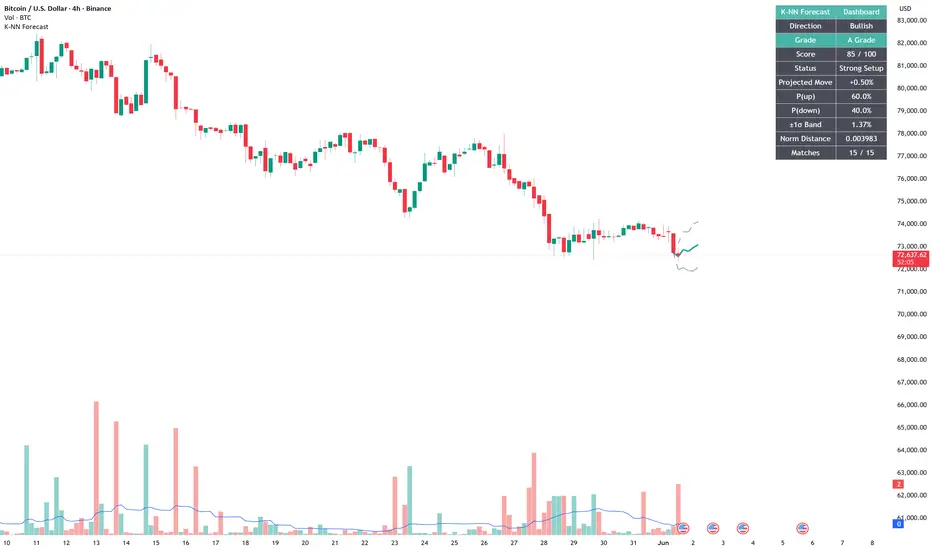
K-NN Pattern Forecast
K-NN Pattern Forecast is an educational forecast indicator that uses historical pattern similarity to project a probabilistic future price path.
The indicator compares the most recent confirmed price pattern with similar historical patterns on the same chart. It then calculates the average forward movement of the closest historical matches and displays a projected path, probability estimates, a quality grade, and a dashboard summary.
This is a forecast indicator, not a trading strategy. It does not place trades, does not simulate orders, and does not provide backtested strategy results. The forecast is probabilistic and based only on historical similarity. It should not be interpreted as a guaranteed prediction, financial advice, or an automatic buy/sell signal.
What the indicator does
The script analyzes recent price behavior and searches historical chart data for similar patterns.
It then estimates what happened after those similar historical patterns and uses that information to create a forward projection.
The indicator displays:
* Forecast direction.
* Forecast path.
* Probability of upward movement.
* Probability of downward movement.
* Projected move percentage.
* ±1 standard deviation forecast band.
* Normalized pattern distance.
* Number of historical matches used.
* Quality score.
* A / B / C grade classification.
* Dashboard summary.
Core concept
The indicator uses a K-Nearest Neighbors style approach.
K-NN is a similarity-based method. Instead of using fixed trend rules or moving-average crosses, the script compares the current market pattern to past patterns and studies the forward movement that followed those historical matches.
The logic is based on the idea that similar price structures may sometimes lead to similar short-term outcomes, but the result is never guaranteed.
How the pattern matching works
1. Current pattern construction
The script builds the current pattern from recent confirmed candles.
It uses log returns between consecutive closes rather than raw price values. This helps normalize the pattern so that the comparison focuses more on shape and movement structure than absolute price level.
2. Historical search
The script searches through a selected historical window and builds comparable historical patterns using the same pattern length.
Each historical candidate is compared with the current pattern.
3. Distance calculation
The script calculates the Euclidean distance between the current pattern and each historical pattern.
A smaller distance means the historical pattern is more similar to the current pattern.
4. K nearest matches
The script selects the closest historical matches based on the K Nearest Neighbors setting.
These selected matches are then used to calculate the forecast.
5. Forward projection
For each selected match, the script studies what happened during the selected forecast horizon after that historical pattern.
The average forward movement becomes the main projected forecast path.
6. Forecast band
The script also calculates dispersion around the forecast using a standard deviation band.
The ±1σ band is intended to show uncertainty around the projected path. A wider band means the historical outcomes were more dispersed and less consistent.
Dashboard explanation
The dashboard summarizes the forecast output:
Direction
Shows whether the average projected move is bullish, bearish, or neutral.
Grade
Classifies forecast quality as A Grade, B Grade, or C Grade.
A Grade means the forecast has stronger alignment according to the script’s scoring model.
B Grade means moderate alignment.
C Grade means weak, noisy, or lower-quality alignment.
The grade is not a guarantee of future movement. It is only a quality classification based on the script’s internal probability, distance, and forecast-band criteria.
Score
Shows the total quality score out of 100.
The score combines:
* Directional probability.
* Normalized distance between the current pattern and historical matches.
* Width of the ±1σ forecast band.
Status
Shows a simplified interpretation of the grade:
* Strong Setup.
* Moderate Setup.
* Weak / Noisy.
Projected Move
Shows the average projected percentage move over the selected forecast horizon.
P(up)
Shows the percentage of selected historical matches that moved upward over the forecast horizon.
P(down)
Shows the percentage of selected historical matches that moved downward over the forecast horizon.
±1σ Band
Shows the estimated one-standard-deviation forecast band percentage.
A smaller band suggests that the selected historical outcomes were more clustered. A larger band suggests more uncertainty.
Normalized Distance
Shows the average similarity distance adjusted by pattern length.
Lower values indicate closer historical similarity. Higher values indicate weaker similarity.
Matches
Shows how many historical matches were used compared with the selected K value.
Forecast grading model
The script uses an internal scoring model based on three elements:
1. Direction probability
Higher directional probability receives a higher score.
For example, if most selected historical matches moved in the same direction, the probability component improves.
2. Normalized distance
Lower normalized distance means the selected historical patterns are more similar to the current pattern.
Closer matches improve the score.
3. Forecast band width
A narrower ±1σ band suggests the historical outcomes were more consistent.
A wider band reduces the score because the forecast has more uncertainty.
A Grade / B Grade / C Grade
A Grade
Represents the strongest forecast quality according to the selected scoring thresholds. It usually means the direction probability is stronger, historical matches are closer, and the forecast band is more controlled.
B Grade
Represents a moderate forecast quality. The setup has some useful alignment, but the forecast is not as strong as A Grade.
C Grade
Represents a weaker or noisier forecast. This can happen when historical similarity is poor, probability is not strong, or the forecast band is wide.
Users can choose to hide C Grade forecasts if they want the chart to display only higher-quality forecast conditions.
Important note about the forecast
This indicator is a forecast tool, but it does not know the future.
The forecast is generated from historical similarity only. Market conditions can change, and a pattern that looked similar in the past may behave differently in the future.
The projected path should be treated as a probabilistic scenario, not a price target and not a trade recommendation.
How to use it
A practical workflow is:
1. Choose a liquid symbol and timeframe.
2. Set the Pattern Length to define how many recent bars form the current pattern.
3. Set the History Search Window to define how much past data the script searches.
4. Set K Nearest Neighbors to control how many similar historical patterns are used.
5. Set the Forecast Horizon to define how many bars forward the projection extends.
6. Review the forecast direction and projected move.
7. Check the probability values and the ±1σ band.
8. Give more weight to forecasts with better grades and lower normalized distance.
9. Avoid treating the forecast path as a guaranteed outcome.
10. Combine the forecast with independent market structure, liquidity, volume, risk management, and higher-timeframe analysis.
Inputs
Pattern Matching
* Pattern Length: number of bars used to define the current pattern.
* History Search Window: number of historical bars searched for similar patterns.
* K Nearest Neighbors: number of closest historical matches used in the forecast.
* Forecast Horizon: number of bars projected forward.
Forecast Quality Filter
* Hide C Grade Forecasts: hides lower-quality forecasts from the chart.
* A Grade Min Score: minimum score required for A Grade.
* B Grade Min Score: minimum score required for B Grade.
* Strong Direction Probability %: probability threshold used in the scoring model.
* Good Direction Probability %: secondary probability threshold used in the scoring model.
* Good Normalized Distance: stricter distance threshold for better similarity.
* Medium Normalized Distance: moderate distance threshold for similarity.
* Good ±1σ Band %: stricter band-width threshold.
* Medium ±1σ Band %: moderate band-width threshold.
Display
* Show Forecast Path: shows or hides the projected forecast path.
* Forecast Path Width: controls the forecast line thickness.
* Show ±1σ Confidence Band: shows or hides the forecast uncertainty band.
* Up Forecast Color: color used for bullish forecasts.
* Down Forecast Color: color used for bearish forecasts.
* Band Color: color used for the ±1σ band.
Dashboard Table
* Show Dashboard Table: shows or hides the dashboard.
* Table Position: controls dashboard location.
* Table Size: controls text size.
* Table Background: controls table background color.
* Table Text Color: controls dashboard text color.
* Table Border Color: controls dashboard border color.
Originality and usefulness
This indicator is designed as a historical-similarity forecast framework rather than a standard trend or momentum overlay.
Its usefulness comes from combining:
* Pattern matching using recent confirmed candle behavior.
* K-nearest historical comparison.
* Average forward path projection.
* Directional probability.
* Forecast dispersion using ±1σ band.
* A transparent quality score and grade.
* A dashboard that explains the current forecast state.
The goal is to help traders study whether the current price structure resembles prior market structures and what the average forward behavior looked like after those historical examples.
Limitations
This indicator does not predict future price with certainty.
A bullish forecast does not guarantee price will rise.
A bearish forecast does not guarantee price will fall.
An A Grade forecast does not guarantee a successful trade.
A C Grade forecast does not mean price cannot move strongly.
The forecast can change when new candles close because the current pattern changes.
The indicator uses confirmed candles only, but the displayed projection is recalculated as new confirmed data becomes available.
The quality of the forecast depends heavily on:
* Symbol.
* Timeframe.
* Available historical data.
* Pattern length.
* Search window.
* Number of neighbors.
* Forecast horizon.
* Market regime.
* Volatility conditions.
* Liquidity conditions.
Historical similarity does not guarantee future repetition.
Recommended use
K-NN Pattern Forecast is best used as an educational probabilistic forecast indicator.
It can help traders compare the current price pattern with similar historical patterns and evaluate possible forward scenarios, but it should always be used with independent analysis and proper risk management.
K-NN Pattern Forecast is an educational forecast indicator that uses historical pattern similarity to project a probabilistic future price path.
The indicator compares the most recent confirmed price pattern with similar historical patterns on the same chart. It then calculates the average forward movement of the closest historical matches and displays a projected path, probability estimates, a quality grade, and a dashboard summary.
This is a forecast indicator, not a trading strategy. It does not place trades, does not simulate orders, and does not provide backtested strategy results. The forecast is probabilistic and based only on historical similarity. It should not be interpreted as a guaranteed prediction, financial advice, or an automatic buy/sell signal.
What the indicator does
The script analyzes recent price behavior and searches historical chart data for similar patterns.
It then estimates what happened after those similar historical patterns and uses that information to create a forward projection.
The indicator displays:
* Forecast direction.
* Forecast path.
* Probability of upward movement.
* Probability of downward movement.
* Projected move percentage.
* ±1 standard deviation forecast band.
* Normalized pattern distance.
* Number of historical matches used.
* Quality score.
* A / B / C grade classification.
* Dashboard summary.
Core concept
The indicator uses a K-Nearest Neighbors style approach.
K-NN is a similarity-based method. Instead of using fixed trend rules or moving-average crosses, the script compares the current market pattern to past patterns and studies the forward movement that followed those historical matches.
The logic is based on the idea that similar price structures may sometimes lead to similar short-term outcomes, but the result is never guaranteed.
How the pattern matching works
1. Current pattern construction
The script builds the current pattern from recent confirmed candles.
It uses log returns between consecutive closes rather than raw price values. This helps normalize the pattern so that the comparison focuses more on shape and movement structure than absolute price level.
2. Historical search
The script searches through a selected historical window and builds comparable historical patterns using the same pattern length.
Each historical candidate is compared with the current pattern.
3. Distance calculation
The script calculates the Euclidean distance between the current pattern and each historical pattern.
A smaller distance means the historical pattern is more similar to the current pattern.
4. K nearest matches
The script selects the closest historical matches based on the K Nearest Neighbors setting.
These selected matches are then used to calculate the forecast.
5. Forward projection
For each selected match, the script studies what happened during the selected forecast horizon after that historical pattern.
The average forward movement becomes the main projected forecast path.
6. Forecast band
The script also calculates dispersion around the forecast using a standard deviation band.
The ±1σ band is intended to show uncertainty around the projected path. A wider band means the historical outcomes were more dispersed and less consistent.
Dashboard explanation
The dashboard summarizes the forecast output:
Direction
Shows whether the average projected move is bullish, bearish, or neutral.
Grade
Classifies forecast quality as A Grade, B Grade, or C Grade.
A Grade means the forecast has stronger alignment according to the script’s scoring model.
B Grade means moderate alignment.
C Grade means weak, noisy, or lower-quality alignment.
The grade is not a guarantee of future movement. It is only a quality classification based on the script’s internal probability, distance, and forecast-band criteria.
Score
Shows the total quality score out of 100.
The score combines:
* Directional probability.
* Normalized distance between the current pattern and historical matches.
* Width of the ±1σ forecast band.
Status
Shows a simplified interpretation of the grade:
* Strong Setup.
* Moderate Setup.
* Weak / Noisy.
Projected Move
Shows the average projected percentage move over the selected forecast horizon.
P(up)
Shows the percentage of selected historical matches that moved upward over the forecast horizon.
P(down)
Shows the percentage of selected historical matches that moved downward over the forecast horizon.
±1σ Band
Shows the estimated one-standard-deviation forecast band percentage.
A smaller band suggests that the selected historical outcomes were more clustered. A larger band suggests more uncertainty.
Normalized Distance
Shows the average similarity distance adjusted by pattern length.
Lower values indicate closer historical similarity. Higher values indicate weaker similarity.
Matches
Shows how many historical matches were used compared with the selected K value.
Forecast grading model
The script uses an internal scoring model based on three elements:
1. Direction probability
Higher directional probability receives a higher score.
For example, if most selected historical matches moved in the same direction, the probability component improves.
2. Normalized distance
Lower normalized distance means the selected historical patterns are more similar to the current pattern.
Closer matches improve the score.
3. Forecast band width
A narrower ±1σ band suggests the historical outcomes were more consistent.
A wider band reduces the score because the forecast has more uncertainty.
A Grade / B Grade / C Grade
A Grade
Represents the strongest forecast quality according to the selected scoring thresholds. It usually means the direction probability is stronger, historical matches are closer, and the forecast band is more controlled.
B Grade
Represents a moderate forecast quality. The setup has some useful alignment, but the forecast is not as strong as A Grade.
C Grade
Represents a weaker or noisier forecast. This can happen when historical similarity is poor, probability is not strong, or the forecast band is wide.
Users can choose to hide C Grade forecasts if they want the chart to display only higher-quality forecast conditions.
Important note about the forecast
This indicator is a forecast tool, but it does not know the future.
The forecast is generated from historical similarity only. Market conditions can change, and a pattern that looked similar in the past may behave differently in the future.
The projected path should be treated as a probabilistic scenario, not a price target and not a trade recommendation.
How to use it
A practical workflow is:
1. Choose a liquid symbol and timeframe.
2. Set the Pattern Length to define how many recent bars form the current pattern.
3. Set the History Search Window to define how much past data the script searches.
4. Set K Nearest Neighbors to control how many similar historical patterns are used.
5. Set the Forecast Horizon to define how many bars forward the projection extends.
6. Review the forecast direction and projected move.
7. Check the probability values and the ±1σ band.
8. Give more weight to forecasts with better grades and lower normalized distance.
9. Avoid treating the forecast path as a guaranteed outcome.
10. Combine the forecast with independent market structure, liquidity, volume, risk management, and higher-timeframe analysis.
Inputs
Pattern Matching
* Pattern Length: number of bars used to define the current pattern.
* History Search Window: number of historical bars searched for similar patterns.
* K Nearest Neighbors: number of closest historical matches used in the forecast.
* Forecast Horizon: number of bars projected forward.
Forecast Quality Filter
* Hide C Grade Forecasts: hides lower-quality forecasts from the chart.
* A Grade Min Score: minimum score required for A Grade.
* B Grade Min Score: minimum score required for B Grade.
* Strong Direction Probability %: probability threshold used in the scoring model.
* Good Direction Probability %: secondary probability threshold used in the scoring model.
* Good Normalized Distance: stricter distance threshold for better similarity.
* Medium Normalized Distance: moderate distance threshold for similarity.
* Good ±1σ Band %: stricter band-width threshold.
* Medium ±1σ Band %: moderate band-width threshold.
Display
* Show Forecast Path: shows or hides the projected forecast path.
* Forecast Path Width: controls the forecast line thickness.
* Show ±1σ Confidence Band: shows or hides the forecast uncertainty band.
* Up Forecast Color: color used for bullish forecasts.
* Down Forecast Color: color used for bearish forecasts.
* Band Color: color used for the ±1σ band.
Dashboard Table
* Show Dashboard Table: shows or hides the dashboard.
* Table Position: controls dashboard location.
* Table Size: controls text size.
* Table Background: controls table background color.
* Table Text Color: controls dashboard text color.
* Table Border Color: controls dashboard border color.
Originality and usefulness
This indicator is designed as a historical-similarity forecast framework rather than a standard trend or momentum overlay.
Its usefulness comes from combining:
* Pattern matching using recent confirmed candle behavior.
* K-nearest historical comparison.
* Average forward path projection.
* Directional probability.
* Forecast dispersion using ±1σ band.
* A transparent quality score and grade.
* A dashboard that explains the current forecast state.
The goal is to help traders study whether the current price structure resembles prior market structures and what the average forward behavior looked like after those historical examples.
Limitations
This indicator does not predict future price with certainty.
A bullish forecast does not guarantee price will rise.
A bearish forecast does not guarantee price will fall.
An A Grade forecast does not guarantee a successful trade.
A C Grade forecast does not mean price cannot move strongly.
The forecast can change when new candles close because the current pattern changes.
The indicator uses confirmed candles only, but the displayed projection is recalculated as new confirmed data becomes available.
The quality of the forecast depends heavily on:
* Symbol.
* Timeframe.
* Available historical data.
* Pattern length.
* Search window.
* Number of neighbors.
* Forecast horizon.
* Market regime.
* Volatility conditions.
* Liquidity conditions.
Historical similarity does not guarantee future repetition.
Recommended use
K-NN Pattern Forecast is best used as an educational probabilistic forecast indicator.
It can help traders compare the current price pattern with similar historical patterns and evaluate possible forward scenarios, but it should always be used with independent analysis and proper risk management.
نص برمجي مفتوح المصدر
بروح TradingView الحقيقية، قام مبتكر هذا النص البرمجي بجعله مفتوح المصدر، بحيث يمكن للمتداولين مراجعة وظائفه والتحقق منها. شكرا للمؤلف! بينما يمكنك استخدامه مجانًا، تذكر أن إعادة نشر الكود يخضع لقواعد الموقع الخاصة بنا.

إخلاء المسؤولية
لا يُقصد بالمعلومات والمنشورات أن تكون، أو تشكل، أي نصيحة مالية أو استثمارية أو تجارية أو أنواع أخرى من النصائح أو التوصيات المقدمة أو المعتمدة من TradingView. اقرأ المزيد في شروط الاستخدام.
نص برمجي مفتوح المصدر
بروح TradingView الحقيقية، قام مبتكر هذا النص البرمجي بجعله مفتوح المصدر، بحيث يمكن للمتداولين مراجعة وظائفه والتحقق منها. شكرا للمؤلف! بينما يمكنك استخدامه مجانًا، تذكر أن إعادة نشر الكود يخضع لقواعد الموقع الخاصة بنا.
إخلاء المسؤولية
لا يُقصد بالمعلومات والمنشورات أن تكون، أو تشكل، أي نصيحة مالية أو استثمارية أو تجارية أو أنواع أخرى من النصائح أو التوصيات المقدمة أو المعتمدة من TradingView. اقرأ المزيد في شروط الاستخدام.