OAK MT-RF Unified Engine Pro
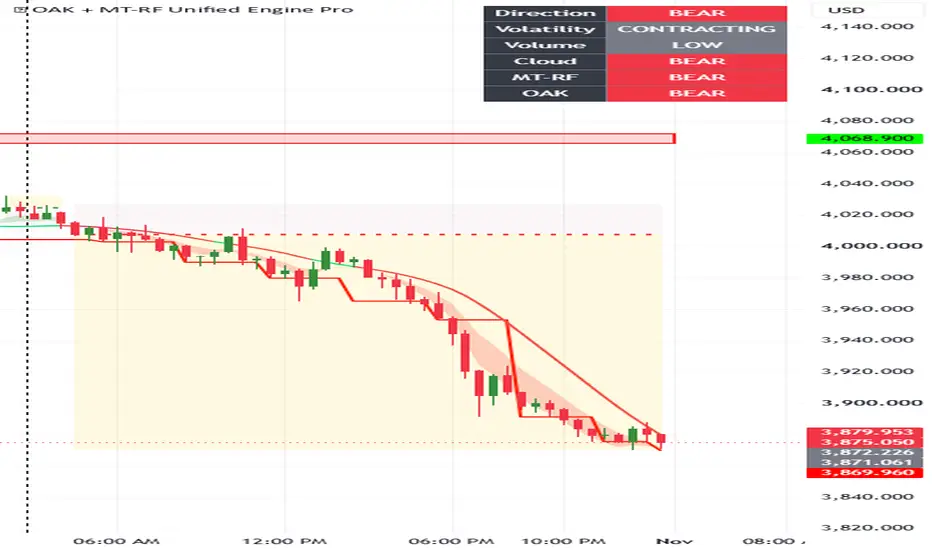
🌳 OAK + MT-RF Unified Engine Pro. Welcome to the OAK + MT-RF Unified Engine Pro, an institutional-grade technical analysis suite built for modern traders. This indicator combines multi-timeframe swing structures, advanced trend-momentum tracking, dynamic risk-to-reward visualization, and smart Fibonacci retracements into a single, cohesive power house.
Designed to eliminate chart clutter while maximizing clarity, it provides real-time market insights so you can make informed decisions with confidence.
🌟 Key Features & Core Components
🌲 1. OAK Higher-Timeframe Structure Multi-Timeframe Analysis: Filters out lower-timeframe market noise by evaluating higher-timeframe swing highs and lows. Breakout & Zone Tracking: Highlights key structural shifts and plots dynamic profit and risk zones directly on your chart as trends evolve.
🌊 2. MT-RF Trend & Momentum Cloud Hull Moving Average (HMA): Smooths price action to capture primary trend momentum accurately with minimal lag. Double Exponential Moving Average (DEMA) Cloud: Uses fast and slow DEMAs combined with a trend filter to shade the background, visually displaying bullish or bearish momentum strength.
📊 3. Live Dashboard & Metrics Panel Real-Time Overview: A clean summary panel attached to the top right of your chart displaying current market direction, volatility state, volume conditions, and sub-indicator alignment. Multi-Confirmation Logic: Requires consensus across multiple engines before confirming a trend change, drastically reducing false signals.
🎯 4. Visual Long/Short Risk-Reward Visualizer Automated Risk Management: Automatically outlines entry lines, risk zones (stop-loss estimates), and expanding profit zones (take-profit levels) based on real-time volatility and volume factors. Dynamic Adjustment: Adapts live as the market moves in your favor, helping you visualize potential trades clearly.
📐 5. Dynamic Fibonacci Retracements Automated Key Levels: Automatically calculates and plots critical Fibonacci retracement zones based on active swing structures. Color-Coded Feedback: Lines dynamically shift colors based on price interaction to let you gauge market sentiment at a glance.
🎛️ Customization & Inputs You can easily tailor the indicator to fit your trading style through the settings menu: Visualization: Toggle profit/risk zones on or off, customize zone colors, and adjust entry line styles (Solid, Dashed, Dotted) and widths. Historical Data: Choose whether to display historical Fibonacci lines to keep your chart clean or analyze past setups.
🔔 Built-in Alerts Never miss a crucial market shift. The indicator includes pre-configured alert conditions for: BULL Trend Switch: Instant notification when market alignment shifts to bullish. BEAR Trend Switch: Instant notification when market alignment shifts to bearish. Developed by Ummer Aftab ( OAKTLIVE ) OAK !!
Designed to eliminate chart clutter while maximizing clarity, it provides real-time market insights so you can make informed decisions with confidence.
🌟 Key Features & Core Components
🌲 1. OAK Higher-Timeframe Structure Multi-Timeframe Analysis: Filters out lower-timeframe market noise by evaluating higher-timeframe swing highs and lows. Breakout & Zone Tracking: Highlights key structural shifts and plots dynamic profit and risk zones directly on your chart as trends evolve.
🌊 2. MT-RF Trend & Momentum Cloud Hull Moving Average (HMA): Smooths price action to capture primary trend momentum accurately with minimal lag. Double Exponential Moving Average (DEMA) Cloud: Uses fast and slow DEMAs combined with a trend filter to shade the background, visually displaying bullish or bearish momentum strength.
📊 3. Live Dashboard & Metrics Panel Real-Time Overview: A clean summary panel attached to the top right of your chart displaying current market direction, volatility state, volume conditions, and sub-indicator alignment. Multi-Confirmation Logic: Requires consensus across multiple engines before confirming a trend change, drastically reducing false signals.
🎯 4. Visual Long/Short Risk-Reward Visualizer Automated Risk Management: Automatically outlines entry lines, risk zones (stop-loss estimates), and expanding profit zones (take-profit levels) based on real-time volatility and volume factors. Dynamic Adjustment: Adapts live as the market moves in your favor, helping you visualize potential trades clearly.
📐 5. Dynamic Fibonacci Retracements Automated Key Levels: Automatically calculates and plots critical Fibonacci retracement zones based on active swing structures. Color-Coded Feedback: Lines dynamically shift colors based on price interaction to let you gauge market sentiment at a glance.
🎛️ Customization & Inputs You can easily tailor the indicator to fit your trading style through the settings menu: Visualization: Toggle profit/risk zones on or off, customize zone colors, and adjust entry line styles (Solid, Dashed, Dotted) and widths. Historical Data: Choose whether to display historical Fibonacci lines to keep your chart clean or analyze past setups.
🔔 Built-in Alerts Never miss a crucial market shift. The indicator includes pre-configured alert conditions for: BULL Trend Switch: Instant notification when market alignment shifts to bullish. BEAR Trend Switch: Instant notification when market alignment shifts to bearish. Developed by Ummer Aftab ( OAKTLIVE ) OAK !!

إخلاء المسؤولية
لا يُقصد بالمعلومات والمنشورات أن تكون، أو تشكل، أي نصيحة مالية أو استثمارية أو تجارية أو أنواع أخرى من النصائح أو التوصيات المقدمة أو المعتمدة من TradingView. اقرأ المزيد في شروط الاستخدام.
إخلاء المسؤولية
لا يُقصد بالمعلومات والمنشورات أن تكون، أو تشكل، أي نصيحة مالية أو استثمارية أو تجارية أو أنواع أخرى من النصائح أو التوصيات المقدمة أو المعتمدة من TradingView. اقرأ المزيد في شروط الاستخدام.