OPEN-SOURCE SCRIPT
تم تحديثه Manias, Panics and Crashes
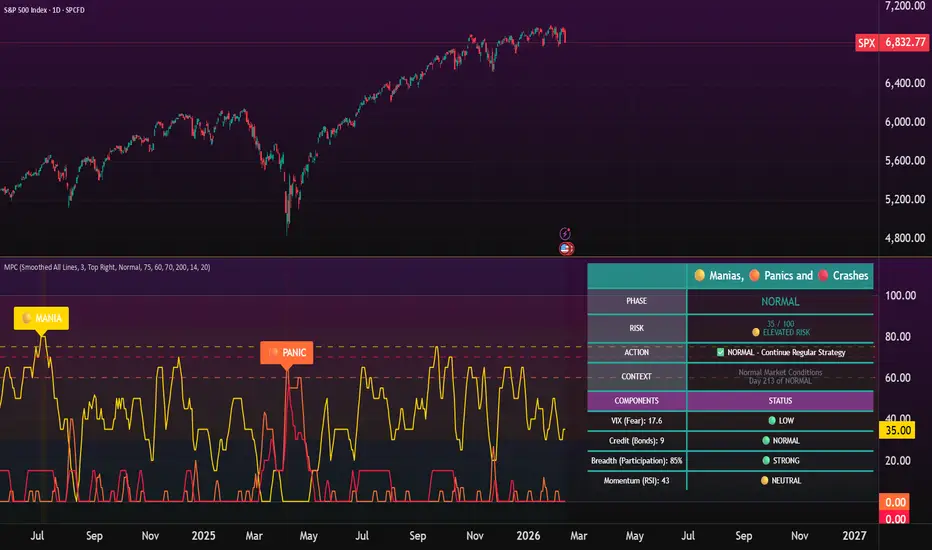
I got inspired to build the Manias Panics and Crashes indicator after reading the book "Manias, Panics and Crashes" by Charles Kindleberger's and Hyman Minsky's Financial Instability Hypothesis. This indicator identifies the three critical phases of market cycles, from manias, to panics, to crashes by analyzing multiple dimensions of market behavior including volatility, credit stress, market breadth, and momentum.
As you will be able to see, a panic or crash is often anticipated by a mania.
Here's how it works:
I Use multi-dimensional risk analysis which includes:
The indicator scores three distinct market phases (0-100 scale):
🟡 MANIA: Euphoric speculation, extended valuations, complacency (VIX <20, RSI >70)
🟠 PANIC: Sharp deterioration, fear acceleration, breadth collapse
🔴 CRASH: Capitulation events, extreme volatility (VIX >40), credit freeze
This indicator implements the classic boom-bust cycle model:
1. Displacement → Credit Expansion → Mania/Euphoria
2. Critical Stage → Panic/Financial Distress
3. Revulsion → Crash
This framework has successfully identified major market crises for over 300 years of financial history, and you can backtest it yourself.
Scoring Methodology
Each phase receives a score (0-100) based on multiple factors:
MANIA Score Components
PANIC Score Components:
CRASH Score Components:
The indicator automatically pulls from multiple data feeds:
For Traders: Use the indicator to adjust risk based on market phase. During NORMAL conditions, trade normally. In MANIA, reduce positions and take profits. During PANIC, raise cash and avoid catching knives. In CRASH, prepare your shopping list and wait for capitulation signs before deploying capital.
For Investors: Maintain target allocation during NORMAL markets. When MANIA is detected, rebalance to defensive sectors and build cash reserves. During PANIC/CRASH phases, deploy cash into quality names at extreme fear levels, as these periods create the best long-term buying opportunities.
Historical Performance
The indicator successfully identified:
COVID-19 Crash (March 2020): MANIA signals in Feb 2020, PANIC phase Mar 12-23:

2022 Bear Market: Multiple MANIA warnings in 2021:

January 2018 Selloff: MANIA warnings a few days earlier:

2008 Financial Crisis: Multiple MANIA alerts before the crash:

Note: Past performance does not guarantee future results. This indicator provides context and warning signals but cannot predict exact timing of market events.
This indicator might have some limitations:
Acknowledgments
As always, I'm standing on the shoulders of giants. the indicator was inspired by:
Let me know if you have any comments or suggestions!
- Henrique Centieiro
As you will be able to see, a panic or crash is often anticipated by a mania.
Here's how it works:
I Use multi-dimensional risk analysis which includes:
- VIX Integration: Real-time fear gauge monitoring with spike detection
- Credit Spread Analysis: Tracks HYG/LQD spreads and flight-to-safety indicators (TLT/SPY)
- Market Breadth: Monitors participation levels to detect divergences
- Momentum Indicators: RSI, MACD, and rate-of-change analysis
- Volume Analysis: Identifies climax selling and forced liquidation events
The indicator scores three distinct market phases (0-100 scale):
🟡 MANIA: Euphoric speculation, extended valuations, complacency (VIX <20, RSI >70)
🟠 PANIC: Sharp deterioration, fear acceleration, breadth collapse
🔴 CRASH: Capitulation events, extreme volatility (VIX >40), credit freeze
This indicator implements the classic boom-bust cycle model:
1. Displacement → Credit Expansion → Mania/Euphoria
- Excessive leverage, speculation replacing investment
- Measured: Price >15% above 200-MA, RSI overbought >10 days, VIX <20
2. Critical Stage → Panic/Financial Distress
- Smart money exits, credit spreads widen
- Measured: Sharp declines, VIX spikes, breadth deterioration
3. Revulsion → Crash
- Forced liquidation, credit freeze, herd panic
- Measured: VIX >40, extreme volume, breadth <20%, credit stress >60
This framework has successfully identified major market crises for over 300 years of financial history, and you can backtest it yourself.
Scoring Methodology
Each phase receives a score (0-100) based on multiple factors:
MANIA Score Components
- Price deviation from 200-day MA (>15% = elevated)
- RSI overbought duration (>70 for 10+ days)
- Market breadth (>60% stocks rising)
- Low volatility complacency (VIX <20)
- Accelerating momentum (ROC increasing)
PANIC Score Components:
- Moderate declines (-5% to -15% from peak)
- VIX spike (>30% increase in 5 days)
- High volume on down days (>150% average)
- Breadth deterioration (<40% participation)
- Credit stress emergence (spreads widening >2%)
- Momentum reversal (MACD bearish cross)
CRASH Score Components:
- Extreme declines (>15% from peak)
- VIX extreme (>40)
- Volume climax (>200% average)
- Breadth collapse (<20% participation)
- High correlation (forced selling across sectors)
- Credit freeze (spreads >10% wider)
The indicator automatically pulls from multiple data feeds:
- TVC:VIX - CBOE Volatility Index
- AMEX:HYG / AMEX:LQD - Credit spread proxy (High Yield vs Investment Grade)
- NASDAQ:TLT / AMEX:SPY - Flight-to-safety indicator (Treasuries vs Equities)
- AMEX:XLF - Financial sector health
- INDEX:ADDN - NYSE Advance/Decline for breadth
For Traders: Use the indicator to adjust risk based on market phase. During NORMAL conditions, trade normally. In MANIA, reduce positions and take profits. During PANIC, raise cash and avoid catching knives. In CRASH, prepare your shopping list and wait for capitulation signs before deploying capital.
For Investors: Maintain target allocation during NORMAL markets. When MANIA is detected, rebalance to defensive sectors and build cash reserves. During PANIC/CRASH phases, deploy cash into quality names at extreme fear levels, as these periods create the best long-term buying opportunities.
Historical Performance
The indicator successfully identified:
COVID-19 Crash (March 2020): MANIA signals in Feb 2020, PANIC phase Mar 12-23:
2022 Bear Market: Multiple MANIA warnings in 2021:
January 2018 Selloff: MANIA warnings a few days earlier:
2008 Financial Crisis: Multiple MANIA alerts before the crash:
Note: Past performance does not guarantee future results. This indicator provides context and warning signals but cannot predict exact timing of market events.
This indicator might have some limitations:
- False Positives: Mania phases can persist for months/years before corrections (see phase from 1996 until the doc com crash)
- Lag: Some indicators are reactive rather than predictive
- Data Availability: It works pretty much only for the US markets
- Timeframe Sensitivity: Best on daily/weekly charts; intraday may be noisy and I didn't try it
Acknowledgments
As always, I'm standing on the shoulders of giants. the indicator was inspired by:
- Charles Kindleberger's "Manias, Panics and Crashes"
- Hyman Minsky's Financial Instability Hypothesis
- Behavioral finance research by Robert Shiller
Let me know if you have any comments or suggestions!
- Henrique Centieiro
ملاحظات الأخبار
Fixed Version - April 2, 2026What's Fixed:
Performance
- Removed unused INDEX:ADDN data request (7→6 security requests)
- Faster loading, especially on lower timeframes
- Better compatibility with free TradingView accounts
Safety
- Added zero-division protection to all ratio calculations
- Fixed potential crashes during market halts or data gaps
Clarity
- Renamed "Breadth (Participation)" to "Trend Strength" (more accurate)
- Reduced max labels from 500 to 100 (less clutter)
نص برمجي مفتوح المصدر
بروح TradingView الحقيقية، قام مبتكر هذا النص البرمجي بجعله مفتوح المصدر، بحيث يمكن للمتداولين مراجعة وظائفه والتحقق منها. شكرا للمؤلف! بينما يمكنك استخدامه مجانًا، تذكر أن إعادة نشر الكود يخضع لقواعد الموقع الخاصة بنا.

Hedge Fund Manager at Maverick Capital | Wealth Educator | 20+ yrs investing | Stocks, ETFs & Crypto alerts | Join Henrique Wealth Academy for trade alerts & indicators → skool.com/be-limitless/
إخلاء المسؤولية
لا يُقصد بالمعلومات والمنشورات أن تكون، أو تشكل، أي نصيحة مالية أو استثمارية أو تجارية أو أنواع أخرى من النصائح أو التوصيات المقدمة أو المعتمدة من TradingView. اقرأ المزيد في شروط الاستخدام.
نص برمجي مفتوح المصدر
بروح TradingView الحقيقية، قام مبتكر هذا النص البرمجي بجعله مفتوح المصدر، بحيث يمكن للمتداولين مراجعة وظائفه والتحقق منها. شكرا للمؤلف! بينما يمكنك استخدامه مجانًا، تذكر أن إعادة نشر الكود يخضع لقواعد الموقع الخاصة بنا.
Hedge Fund Manager at Maverick Capital | Wealth Educator | 20+ yrs investing | Stocks, ETFs & Crypto alerts | Join Henrique Wealth Academy for trade alerts & indicators → skool.com/be-limitless/
إخلاء المسؤولية
لا يُقصد بالمعلومات والمنشورات أن تكون، أو تشكل، أي نصيحة مالية أو استثمارية أو تجارية أو أنواع أخرى من النصائح أو التوصيات المقدمة أو المعتمدة من TradingView. اقرأ المزيد في شروط الاستخدام.