OPEN-SOURCE SCRIPT
[SW Lab] Signal Decay Monitor
## What It Does
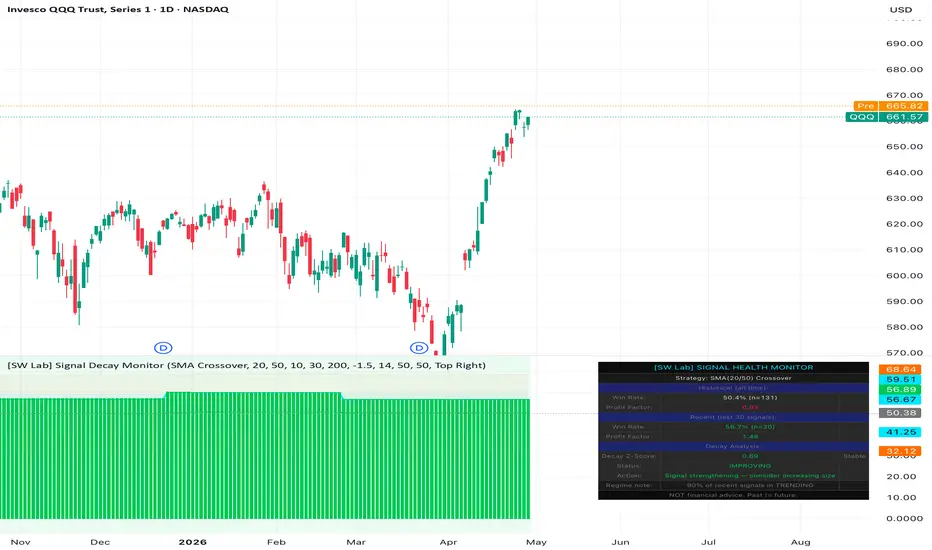
Every trading signal has a shelf life. A strategy that delivered strong returns for six months can quietly stop working as markets adapt -- and most traders only notice after weeks of losses. The Signal Decay Monitor uses a statistical Z-test to continuously compare a strategy's recent performance against its historical baseline, flagging degradation before your P&L does.
## How It Works
- Select any of 6 built-in strategies (SMA Crossover, RSI Reversal, MACD Signal, Bollinger Bounce, Breakout, Mean Reversion) and the indicator tracks every signal and its forward return
- Computes a rolling win rate over a configurable recent window (default: last 30 evaluated signals) and compares it to the full historical win rate
- Performs a Z-test to determine whether the difference between recent and historical performance is statistically significant or just normal variance
- Plots confidence bands (1-sigma and 2-sigma) around the historical baseline so you can visually distinguish meaningful decay from noise
- Tracks which market regime recent signals occurred in, helping you determine if the strategy failed or if the regime simply shifted
## Key Features
- **Rolling win rate oscillator** (cyan line) showing recent signal performance in real time
- **Historical baseline** (gray line) for long-term average win rate reference
- **1-sigma and 2-sigma confidence bands** showing expected statistical variation
- **Z-score histogram** providing a visual representation of the decay score
- **Background color changes** with health status for instant visual assessment
- **Regime analysis** in the info panel identifying whether losses concentrate in a specific regime
- **Info panel** with complete breakdown: health status, Z-score, recent vs. historical win rate, signal counts, and regime notes
## Signal Interpretation
| Health Status | Z-Score Range | Meaning | Recommended Action |
|--------------|---------------|---------|-------------------|
| HEALTHY | Z > -0.5 | Edge intact | Trade normally |
| IMPROVING | Z > +0.5 | Signal getting stronger | Consider increasing size |
| WEAKENING | -0.5 to -1.5 | Early warning | Monitor closely, tighten stops |
| DEGRADING | -1.5 to -2.5 | Significant decay detected | Reduce position size |
| DEAD | Z < -2.5 | Edge is gone | Stop trading this signal |
| NEVER PROFITABLE | N/A | Strategy never had an edge | Do not trade on this asset |
## Settings Guide
| Parameter | Default | Description |
|-----------|---------|-------------|
| Strategy | SMA Crossover | Which strategy's signal health to monitor |
| Fast Length | 20 | Primary period for the selected strategy |
| Slow Length | 50 | Secondary period for the selected strategy |
| Recent Window | 30 | Number of recent evaluated signals to compare against baseline |
| Historical Window | 200 | Full history lookback for baseline performance |
| Evaluation Bars | 10 | Forward bars to measure each signal outcome |
| Decay Threshold | -1.5 | Z-score below which health is flagged as decaying |
| ATR Fast / Slow | 14 / 50 | ATR periods for regime detection |
| Trend Length | 50 | SMA period for trend slope calculation |
## Alerts
- Decay detected (Z-score crosses below the configured threshold)
- Signal declared DEAD (Z-score falls below -2.5)
- Signal IMPROVING (Z-score rises above +0.5)
## Best Used For
- Monitoring live strategies for performance degradation before losses accumulate
- Deciding when to retire a signal that has lost its edge
- Distinguishing between a strategy that stopped working and a strategy in a temporarily unfavorable regime
- Validating whether a recently discovered setup maintains its edge over time
- Companion tool to the Backtest Truth Table -- use the Truth Table to find edges, the Decay Monitor to track when they expire
## Academic Foundation
The decay detection is based on a standard two-proportion Z-test, comparing the recent win rate proportion against the historical baseline proportion. This is a well-established statistical hypothesis test used to determine whether observed differences are significant or attributable to sampling noise.
## Disclaimer
This indicator is an analytical tool, not financial advice. Past statistical performance does not guarantee future results. Always apply your own risk management.
Every trading signal has a shelf life. A strategy that delivered strong returns for six months can quietly stop working as markets adapt -- and most traders only notice after weeks of losses. The Signal Decay Monitor uses a statistical Z-test to continuously compare a strategy's recent performance against its historical baseline, flagging degradation before your P&L does.
## How It Works
- Select any of 6 built-in strategies (SMA Crossover, RSI Reversal, MACD Signal, Bollinger Bounce, Breakout, Mean Reversion) and the indicator tracks every signal and its forward return
- Computes a rolling win rate over a configurable recent window (default: last 30 evaluated signals) and compares it to the full historical win rate
- Performs a Z-test to determine whether the difference between recent and historical performance is statistically significant or just normal variance
- Plots confidence bands (1-sigma and 2-sigma) around the historical baseline so you can visually distinguish meaningful decay from noise
- Tracks which market regime recent signals occurred in, helping you determine if the strategy failed or if the regime simply shifted
## Key Features
- **Rolling win rate oscillator** (cyan line) showing recent signal performance in real time
- **Historical baseline** (gray line) for long-term average win rate reference
- **1-sigma and 2-sigma confidence bands** showing expected statistical variation
- **Z-score histogram** providing a visual representation of the decay score
- **Background color changes** with health status for instant visual assessment
- **Regime analysis** in the info panel identifying whether losses concentrate in a specific regime
- **Info panel** with complete breakdown: health status, Z-score, recent vs. historical win rate, signal counts, and regime notes
## Signal Interpretation
| Health Status | Z-Score Range | Meaning | Recommended Action |
|--------------|---------------|---------|-------------------|
| HEALTHY | Z > -0.5 | Edge intact | Trade normally |
| IMPROVING | Z > +0.5 | Signal getting stronger | Consider increasing size |
| WEAKENING | -0.5 to -1.5 | Early warning | Monitor closely, tighten stops |
| DEGRADING | -1.5 to -2.5 | Significant decay detected | Reduce position size |
| DEAD | Z < -2.5 | Edge is gone | Stop trading this signal |
| NEVER PROFITABLE | N/A | Strategy never had an edge | Do not trade on this asset |
## Settings Guide
| Parameter | Default | Description |
|-----------|---------|-------------|
| Strategy | SMA Crossover | Which strategy's signal health to monitor |
| Fast Length | 20 | Primary period for the selected strategy |
| Slow Length | 50 | Secondary period for the selected strategy |
| Recent Window | 30 | Number of recent evaluated signals to compare against baseline |
| Historical Window | 200 | Full history lookback for baseline performance |
| Evaluation Bars | 10 | Forward bars to measure each signal outcome |
| Decay Threshold | -1.5 | Z-score below which health is flagged as decaying |
| ATR Fast / Slow | 14 / 50 | ATR periods for regime detection |
| Trend Length | 50 | SMA period for trend slope calculation |
## Alerts
- Decay detected (Z-score crosses below the configured threshold)
- Signal declared DEAD (Z-score falls below -2.5)
- Signal IMPROVING (Z-score rises above +0.5)
## Best Used For
- Monitoring live strategies for performance degradation before losses accumulate
- Deciding when to retire a signal that has lost its edge
- Distinguishing between a strategy that stopped working and a strategy in a temporarily unfavorable regime
- Validating whether a recently discovered setup maintains its edge over time
- Companion tool to the Backtest Truth Table -- use the Truth Table to find edges, the Decay Monitor to track when they expire
## Academic Foundation
The decay detection is based on a standard two-proportion Z-test, comparing the recent win rate proportion against the historical baseline proportion. This is a well-established statistical hypothesis test used to determine whether observed differences are significant or attributable to sampling noise.
## Disclaimer
This indicator is an analytical tool, not financial advice. Past statistical performance does not guarantee future results. Always apply your own risk management.
نص برمجي مفتوح المصدر
بروح TradingView الحقيقية، قام مبتكر هذا النص البرمجي بجعله مفتوح المصدر، بحيث يمكن للمتداولين مراجعة وظائفه والتحقق منها. شكرا للمؤلف! بينما يمكنك استخدامه مجانًا، تذكر أن إعادة نشر الكود يخضع لقواعد الموقع الخاصة بنا.

إخلاء المسؤولية
لا يُقصد بالمعلومات والمنشورات أن تكون، أو تشكل، أي نصيحة مالية أو استثمارية أو تجارية أو أنواع أخرى من النصائح أو التوصيات المقدمة أو المعتمدة من TradingView. اقرأ المزيد في شروط الاستخدام.
نص برمجي مفتوح المصدر
بروح TradingView الحقيقية، قام مبتكر هذا النص البرمجي بجعله مفتوح المصدر، بحيث يمكن للمتداولين مراجعة وظائفه والتحقق منها. شكرا للمؤلف! بينما يمكنك استخدامه مجانًا، تذكر أن إعادة نشر الكود يخضع لقواعد الموقع الخاصة بنا.
إخلاء المسؤولية
لا يُقصد بالمعلومات والمنشورات أن تكون، أو تشكل، أي نصيحة مالية أو استثمارية أو تجارية أو أنواع أخرى من النصائح أو التوصيات المقدمة أو المعتمدة من TradingView. اقرأ المزيد في شروط الاستخدام.