PPT First 5-Minute Candle High/Low
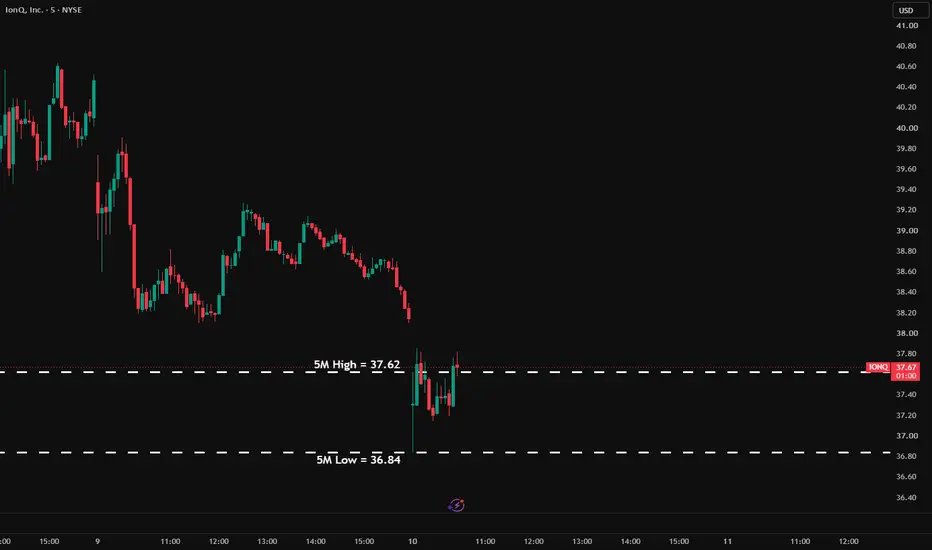
Marks the high and low of the very first 5-minute candle of the trading session — the "opening range" that opening-range-breakout (ORB) traders use as their first reference level of the day.
WHAT IT DOES
At the session open (9:30-9:35 AM ET by default), the indicator watches that opening 5-minute candle form in real time. The instant that candle closes, its high and low are locked in and drawn as two horizontal lines extending forward across the rest of the chart, optionally tagged with price labels ("5M High = ..." / "5M Low = ..."). Those two lines become your reference: a break above the high or below the low is the classic opening-range-breakout signal, while price holding between them marks the range traders can fade.
The lines are drawn fresh every session. By default only today's lines are kept (each new day's lines replace yesterday's); turn off "Show Only Today's Lines" to instead build up a running history of every session's opening range on the chart.
WORKS ON ANY CHART TIMEFRAME
You do not need to be viewing the 5-minute chart. When you are, the indicator reads the high/low directly off your own chart bars; on any other timeframe (1m, 15m, 1H, daily, etc.) it pulls the 5-minute data for you in the background, so the same opening-range lines show up no matter what timeframe you actually trade from.
MULTI-EXCHANGE SESSION SUPPORT
Choose which exchange's regular session open to mark — New York, London, Tokyo, Sydney or Hong Kong — or define your own session time and IANA timezone with the "Custom" option. This makes it useful for opening-range setups on US equities/futures, FX session opens, or other global markets without changing your chart's own timezone.
INPUTS
This is a pure charting/visualization tool — it draws the opening-range levels for you to trade around manually; it does not place trades, plot buy/sell signals, or generate alerts on its own.
WHAT IT DOES
At the session open (9:30-9:35 AM ET by default), the indicator watches that opening 5-minute candle form in real time. The instant that candle closes, its high and low are locked in and drawn as two horizontal lines extending forward across the rest of the chart, optionally tagged with price labels ("5M High = ..." / "5M Low = ..."). Those two lines become your reference: a break above the high or below the low is the classic opening-range-breakout signal, while price holding between them marks the range traders can fade.
The lines are drawn fresh every session. By default only today's lines are kept (each new day's lines replace yesterday's); turn off "Show Only Today's Lines" to instead build up a running history of every session's opening range on the chart.
WORKS ON ANY CHART TIMEFRAME
You do not need to be viewing the 5-minute chart. When you are, the indicator reads the high/low directly off your own chart bars; on any other timeframe (1m, 15m, 1H, daily, etc.) it pulls the 5-minute data for you in the background, so the same opening-range lines show up no matter what timeframe you actually trade from.
MULTI-EXCHANGE SESSION SUPPORT
Choose which exchange's regular session open to mark — New York, London, Tokyo, Sydney or Hong Kong — or define your own session time and IANA timezone with the "Custom" option. This makes it useful for opening-range setups on US equities/futures, FX session opens, or other global markets without changing your chart's own timezone.
INPUTS
- High/Low Line Color — colors for the two opening-range lines
- Line Style / Width — solid, dashed or dotted, and line thickness
- Exchange Timezone — which session's open to track (or Custom)
- Custom Session/Timezone — session time (HHMM-HHMM) and IANA timezone, used only when Exchange = Custom
- Show Only Today's Lines — keep just the current session's lines, or accumulate every past session's lines too
- Show High/Low Labels — toggle the price-value text labels
- Label Text Size — size of those labels
- Label Gap — how far the labels sit from their line, as a percentage of price
This is a pure charting/visualization tool — it draws the opening-range levels for you to trade around manually; it does not place trades, plot buy/sell signals, or generate alerts on its own.

إخلاء المسؤولية
لا يُقصد بالمعلومات والمنشورات أن تكون، أو تشكل، أي نصيحة مالية أو استثمارية أو تجارية أو أنواع أخرى من النصائح أو التوصيات المقدمة أو المعتمدة من TradingView. اقرأ المزيد في شروط الاستخدام.
إخلاء المسؤولية
لا يُقصد بالمعلومات والمنشورات أن تكون، أو تشكل، أي نصيحة مالية أو استثمارية أو تجارية أو أنواع أخرى من النصائح أو التوصيات المقدمة أو المعتمدة من TradingView. اقرأ المزيد في شروط الاستخدام.