تم تحديثه
Pattern & Volume Profile [MarkitTick]
Get this and other exclusive indicators in MarkitTick
This indicator is part of MarkitTick's Paid Space. Subscribe for $43.75/month to use it on your charts along with the author's other exclusive indicators. You pay right on TradingView and get access straight away.
Explore MarkitTick💡 Price rarely moves in straight lines. It coils, consolidates, and compresses before it commits — and the shapes it draws during those pauses have been studied by chart readers for the better part of a century. Pattern & Volume Profile is a single-chart analysis environment that watches for those shapes as they form, measures the quality of each one against a battery of structural checks, and pairs the resulting map of price geometry with a volume-based view of where the market has actually done its business. The result is a tool that answers two questions at once: what shape is price forming right now, and does the volume behind that shape justify paying attention to it. It is built for traders who work from structure — breakout traders, swing traders, and anyone who wants their pattern reads backed by an objective read on participation rather than by eyeballing alone.
Rather than flooding the chart with every squiggle it can find, the tool is deliberately selective. It surfaces the most relevant active formation, frames it with an entry, a protective level, and a measured objective, and then continuously grades it — telling you not just that a flag exists, but how clean it is, how quickly it built, whether a competing pattern disagrees with it, and how much longer it can reasonably be considered valid. Layered underneath is a horizontal volume profile that reveals the price levels where trading has concentrated, so structural signals can be read in the context of genuine acceptance and rejection zones.
✨ Originality and Utility
● A unified structure-and-participation workspace
Most pattern tools stop at drawing a triangle and firing an arrow. Most volume-profile tools ignore chart structure entirely. This indicator fuses both disciplines into one overlay so that a breakout is never evaluated in isolation — it is evaluated against the volume shelf it is breaking away from and the acceptance zone it is leaving behind. That pairing is the core of the tool's value: geometry tells you where the market might go, and the profile tells you whether the market agrees.
● Quality-first, not quantity-first
The engine is designed around the idea that one well-formed pattern is worth more than ten sloppy ones. Every candidate formation passes through a series of structural gates — proportion, symmetry, size relative to volatility, breakout conviction, and participation — before it earns a place on the chart. The tool then keeps the display uncluttered by focusing on the most relevant active setup, so the trader's attention is directed rather than scattered.
● A grading layer that thinks the way an experienced chartist does
Beyond simple detection, the tool exposes a suite of interpretive scores that mirror the judgments a seasoned pattern trader makes instinctively: is this pattern tidy or messy, did it form too fast to trust, is another pattern arguing the opposite direction, is the neckline being respected, and has this setup gone stale. These readings translate hard-won discretionary intuition into consistent, repeatable outputs.
● Execution-ready framing
Each qualifying pattern is presented with a complete trade skeleton: a reference entry, a protective level with a volatility-aware buffer, a measured target derived from the pattern's own dimensions, and optional staged objectives. Risk-to-reward is surfaced with realistic friction — slippage and commission — folded in, so the quality of a setup reflects what a trader would actually experience rather than an idealized paper result.
🔬 Methodology and Concepts

● Pattern Recognition
The tool watches for the classic family of continuation and transition formations that traders have relied on for generations.
● Structural Validation
Every candidate is measured before it is trusted.
● Pattern Intelligence
This layer grades each qualifying setup across several independent dimensions.
● Trade Framing
● Volume Profile
🎨 Visual Guide

● The Active Pattern
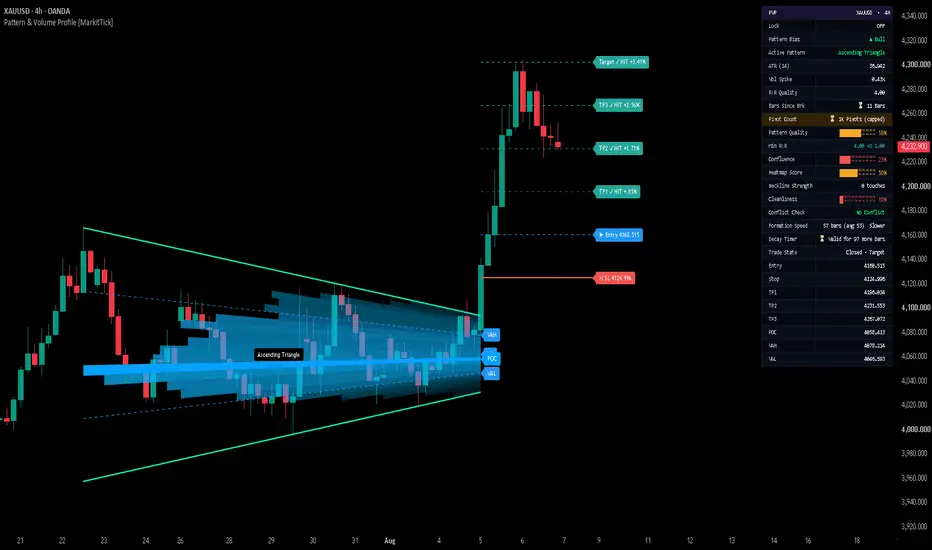
The most relevant qualifying formation is drawn directly on price with its converging or channelling boundaries, filled with a semi-transparent tint keyed to direction — one hue for bullish structures, another for bearish. A compact label names the pattern so it is identified at a glance.
● Trade Skeleton
When a setup qualifies, the chart renders a reference entry line, a protective level, and a measured target, each colour-coded and labelled. Optional staged target lines mark the first, second, and third objectives. Shaded fills between entry and the protective level, and between entry and target, give an immediate visual sense of the risk-to-reward geometry.
● Volume Profile
A horizontal histogram along the price axis shows where activity has concentrated, with row shading scaling from lighter to denser as participation rises. The Point of Control row is highlighted, and the Value Area is shaded as a band with optional boundary lines marking its high, its low, and the control level.
● The Dashboard
A fixed, monospaced panel — positionable to any corner — presents the live state of the analysis in a clean, scannable layout. It reports the directional bias, the active pattern name, current volatility, the participation reading, risk-to-reward quality, structural depth, bars elapsed since the last breakout, and the count of tracked structural points. When their respective modules are enabled, it also surfaces the quality grade, higher-timeframe bias, confluence, heatmap temperature, neckline strength, cleanliness, conflict status, formation speed, decay countdown, and the staged target levels. Readings are colour-graded so that strong, moderate, and weak states are distinguishable at a glance.
● Colour Language
Direction is communicated through a consistent two-hue scheme — a cool tone for bullish conditions and a warm tone for bearish. Score readings shift through a graded palette from strong to neutral so the trader can read conviction by colour alone. Every colour in the tool is user-configurable.
📖 How to Use

● Getting started
Apply the tool to any symbol and timeframe. Out of the box it will begin tracking structure, surface the most relevant active formation with its trade skeleton, and render the volume profile and dashboard. The default settings are a sensible starting point; refinement comes from tailoring the filters to your market and style.
● Reading a setup
Begin with the dashboard. Confirm the directional bias, then check the active pattern name and its quality grade. A high-quality reading, agreement from confluence, a clean structure, and a healthy risk-to-reward figure together describe a setup worth attention. A low grade, a conflict warning, a messy structure, or an expired decay timer are all reasons to stand aside.
● Layering the volume profile
Use the profile to contextualise the geometry. A breakout that clears the Value Area and moves away from a well-defined Point of Control carries more weight than one that stalls inside a dense acceptance zone. The Value Area edges and the control level make natural reference points for targets and protective placement.
● Aligning with the bigger picture
Enable higher-timeframe bias to filter for setups that agree with the broader trend. Taking continuation patterns in the direction of the larger trend, and treating counter-trend signals with added caution, is a durable way to tilt the odds.
● Managing the trade
Use the reference entry, protective level, and measured target as a framework rather than a mandate. Staged objectives support scaling out. The decay timer helps you retire a setup that has aged past its useful window, and the conflict warning helps you avoid committing when the structure is contested.
● Automation
Alerts can be dispatched as structured messages carrying the entry, protective level, and target, with configurable action labels — supporting hands-off routing to compatible automation endpoints while keeping the trader in control of the logic.
● Workflows the tool supports
⚙️ Inputs and Settings

● Core Settings
● Patterns
● Pivot
● Filters
● Visuals
● Volume Profile
● Dashboard
● Pattern Intelligence
● Alerts
● Colors
🔍 Deconstruction of the Underlying Scientific and Academic Framework
● Classical chart pattern theory
The formation vocabulary at the heart of this tool descends directly from the foundational literature of technical analysis. The systematic treatment of flags, pennants, wedges, and triangles as continuation and reversal structures traces to Edwards and Magee's Technical Analysis of Stock Trends, the canonical reference that formalised pattern classification, and to the statistical cataloguing of pattern behaviour in the work of Thomas Bulkowski. The practice of projecting a measured objective from a pattern's own dimensions is a direct inheritance from this tradition.
● Auction market theory and volume at price
The volume-profile component rests on the auction-market framework developed by J. Peter Steidlmayer and elaborated in the Market Profile literature by Jim Dalton. Central to this view is the idea that markets seek areas of value through a continuous two-sided auction, that the point of greatest accepted activity acts as a reference around which price rotates, and that the value area delineates the zone of perceived fair pricing. Reading structure against these acceptance and rejection zones grounds pattern signals in participation rather than price alone.
● Volatility normalisation
The tool's reliance on a volatility measure to scale size thresholds, protective buffers, and boundary tolerances reflects the enduring influence of J. Welles Wilder's introduction of Average True Range in New Concepts in Technical Trading Systems. Normalising structural judgments to prevailing volatility allows the same logic to behave consistently across instruments and regimes.
● Trend context and multi-timeframe alignment
The higher-timeframe bias filter operationalises the long-standing principle — articulated across the works of Charles Dow and later trend theorists — that signals aligned with the dominant trend of a larger degree carry a structural advantage. Reading a lower-timeframe setup through the lens of a higher-timeframe lean is a formalisation of top-down analysis.
● Participation confirmation
The optional requirement that breakouts be accompanied by elevated activity reflects the classical volume-confirmation doctrine, a thread running from the earliest Dow-theory writings through Joseph Granville's work on volume as a leading indicator of price. The premise is simple and durable: conviction leaves a footprint in participation.
● Risk-adjusted evaluation
The insistence on a realistic risk-to-reward read that folds in transaction friction echoes the broader discipline of risk-adjusted performance evaluation. Just as the study of returns is meaningless without the study of the risk taken to earn them, a pattern signal is incomplete without an honest accounting of its payoff geometry and the frictional costs of acting on it.
⚠️ Disclaimer
This tool is provided for educational and informational purposes only. It does not constitute financial, investment, or trading advice, nor a recommendation to buy, sell, or hold any instrument. Chart patterns, volume analysis, and the derived scores are analytical aids, not forecasts; markets are inherently uncertain and no method can predict future price movement. Past behaviour of any pattern or signal is not a reliable indicator of future results. All trading involves substantial risk of loss, and you are solely responsible for your own decisions and their outcomes. Test any approach thoroughly and consider consulting a licensed professional before committing capital. We accept no liability for any loss or damage arising from the use of this tool.
Rather than flooding the chart with every squiggle it can find, the tool is deliberately selective. It surfaces the most relevant active formation, frames it with an entry, a protective level, and a measured objective, and then continuously grades it — telling you not just that a flag exists, but how clean it is, how quickly it built, whether a competing pattern disagrees with it, and how much longer it can reasonably be considered valid. Layered underneath is a horizontal volume profile that reveals the price levels where trading has concentrated, so structural signals can be read in the context of genuine acceptance and rejection zones.
✨ Originality and Utility
● A unified structure-and-participation workspace
Most pattern tools stop at drawing a triangle and firing an arrow. Most volume-profile tools ignore chart structure entirely. This indicator fuses both disciplines into one overlay so that a breakout is never evaluated in isolation — it is evaluated against the volume shelf it is breaking away from and the acceptance zone it is leaving behind. That pairing is the core of the tool's value: geometry tells you where the market might go, and the profile tells you whether the market agrees.
● Quality-first, not quantity-first
The engine is designed around the idea that one well-formed pattern is worth more than ten sloppy ones. Every candidate formation passes through a series of structural gates — proportion, symmetry, size relative to volatility, breakout conviction, and participation — before it earns a place on the chart. The tool then keeps the display uncluttered by focusing on the most relevant active setup, so the trader's attention is directed rather than scattered.
● A grading layer that thinks the way an experienced chartist does
Beyond simple detection, the tool exposes a suite of interpretive scores that mirror the judgments a seasoned pattern trader makes instinctively: is this pattern tidy or messy, did it form too fast to trust, is another pattern arguing the opposite direction, is the neckline being respected, and has this setup gone stale. These readings translate hard-won discretionary intuition into consistent, repeatable outputs.
● Execution-ready framing
Each qualifying pattern is presented with a complete trade skeleton: a reference entry, a protective level with a volatility-aware buffer, a measured target derived from the pattern's own dimensions, and optional staged objectives. Risk-to-reward is surfaced with realistic friction — slippage and commission — folded in, so the quality of a setup reflects what a trader would actually experience rather than an idealized paper result.
🔬 Methodology and Concepts
● Pattern Recognition
The tool watches for the classic family of continuation and transition formations that traders have relied on for generations.
- Bullish and Bearish Flags — Brief, counter-trend consolidations that lean against the prevailing move, typically resolving in the direction of the impulse that preceded them. A strong reading here reflects a tight, well-proportioned channel with a decisive breakout.
- Bullish and Bearish Pennants — Small symmetrical compressions that follow a sharp move, representing a pause before continuation. Their value lies in the tightness of the coil and the sharpness of the release.
- Rising and Falling Wedges — Converging structures that lean with a slope, often signalling exhaustion of the prevailing move and a reversal of pressure. The interpretive weight depends on how cleanly the boundaries converge and where price breaks.
- Triangles — Converging ranges that reflect a balance between buyers and sellers tightening toward a resolution point. A quality triangle shows repeated, respected touches of both boundaries before the break.
● Structural Validation
Every candidate is measured before it is trusted.
- Proportion and Symmetry — Quantifies how balanced a formation is against a user-defined tolerance. Well-balanced structures are historically more reliable than lopsided ones.
- Size Qualification — Screens out formations too small to be meaningful, judged both against price and against prevailing volatility, so noise is not mistaken for structure.
- Breakout Conviction — Assesses whether price has genuinely committed beyond a boundary, with optional requirements for closing beyond the line, breaking with a full candle body, and sustaining the move across consecutive bars.
- Participation Filter — Optionally requires a surge in activity to accompany a breakout, reflecting the long-standing principle that moves backed by volume are more trustworthy than moves that are not.
● Pattern Intelligence
This layer grades each qualifying setup across several independent dimensions.
- Pattern Quality Score — A composite grade that blends the structural checks into a single readable figure. Higher readings reflect setups that satisfy more of the tool's reliability criteria; lower readings flag formations that pass detection but carry caveats.
- Multi-Pattern Confluence — Reflects how many independent signals point the same direction at once. Agreement across signals strengthens conviction; isolation weakens it.
- Pattern Heatmap Score — A consolidated temperature reading of the current opportunity, letting the trader gauge at a glance whether conditions are hot or cold.
- Higher Timeframe Bias — Surfaces the directional lean of a larger timeframe so that setups can be filtered for alignment with the broader trend rather than fought against it.
- Neckline Strength Decay — Reflects how often and how faithfully a key boundary has been respected. A frequently and cleanly touched level carries more significance than one grazed once.
- Pattern Cleanliness Score — Captures how tightly price has hugged the formation's boundaries. Tidy structures with little wandering read as clean; erratic, choppy formations read as messy.
- Cross-Pattern Conflict Warning — Flags situations where a competing formation argues the opposite direction, warning the trader that the picture is contested rather than clear.
- Formation Speed Score — Reflects how quickly a pattern built relative to its historical norm. Formations that assemble unusually fast can behave differently from those that develop at a measured pace.
- Pattern Decay Timer — Communicates how much longer a setup can reasonably be considered valid before age erodes its relevance, discouraging trades on stale structure.
● Trade Framing
- Measured Targets — Objectives derived from the formation's own dimensions, following the traditional practice of projecting a pattern's height from its breakout point.
- Protective Levels — A stop reference set with a volatility-aware buffer, or optionally sized as a fraction of the target distance, so protection scales with conditions.
- Staged Objectives — Optional first, second, and third targets that support scaling out of a position in tranches.
- Risk-to-Reward Quality — A realistic read on the payoff of a setup that accounts for slippage and commission, filtering out trades whose reward does not justify their risk.
● Volume Profile
- Volume-at-Price Distribution — Reveals how trading activity has been distributed across price levels, exposing where the market has spent the most effort.
- Point of Control — Highlights the single price level of greatest accepted activity, often a magnet and a decision point for future moves.
- Value Area — Marks the band of prices that contains the bulk of activity, defining where the market considers itself in balance. Edges of this band frequently act as support and resistance.
🎨 Visual Guide
● The Active Pattern
The most relevant qualifying formation is drawn directly on price with its converging or channelling boundaries, filled with a semi-transparent tint keyed to direction — one hue for bullish structures, another for bearish. A compact label names the pattern so it is identified at a glance.
● Trade Skeleton
When a setup qualifies, the chart renders a reference entry line, a protective level, and a measured target, each colour-coded and labelled. Optional staged target lines mark the first, second, and third objectives. Shaded fills between entry and the protective level, and between entry and target, give an immediate visual sense of the risk-to-reward geometry.
● Volume Profile
A horizontal histogram along the price axis shows where activity has concentrated, with row shading scaling from lighter to denser as participation rises. The Point of Control row is highlighted, and the Value Area is shaded as a band with optional boundary lines marking its high, its low, and the control level.
● The Dashboard
A fixed, monospaced panel — positionable to any corner — presents the live state of the analysis in a clean, scannable layout. It reports the directional bias, the active pattern name, current volatility, the participation reading, risk-to-reward quality, structural depth, bars elapsed since the last breakout, and the count of tracked structural points. When their respective modules are enabled, it also surfaces the quality grade, higher-timeframe bias, confluence, heatmap temperature, neckline strength, cleanliness, conflict status, formation speed, decay countdown, and the staged target levels. Readings are colour-graded so that strong, moderate, and weak states are distinguishable at a glance.
● Colour Language
Direction is communicated through a consistent two-hue scheme — a cool tone for bullish conditions and a warm tone for bearish. Score readings shift through a graded palette from strong to neutral so the trader can read conviction by colour alone. Every colour in the tool is user-configurable.
📖 How to Use
● Getting started
Apply the tool to any symbol and timeframe. Out of the box it will begin tracking structure, surface the most relevant active formation with its trade skeleton, and render the volume profile and dashboard. The default settings are a sensible starting point; refinement comes from tailoring the filters to your market and style.
● Reading a setup
Begin with the dashboard. Confirm the directional bias, then check the active pattern name and its quality grade. A high-quality reading, agreement from confluence, a clean structure, and a healthy risk-to-reward figure together describe a setup worth attention. A low grade, a conflict warning, a messy structure, or an expired decay timer are all reasons to stand aside.
● Layering the volume profile
Use the profile to contextualise the geometry. A breakout that clears the Value Area and moves away from a well-defined Point of Control carries more weight than one that stalls inside a dense acceptance zone. The Value Area edges and the control level make natural reference points for targets and protective placement.
● Aligning with the bigger picture
Enable higher-timeframe bias to filter for setups that agree with the broader trend. Taking continuation patterns in the direction of the larger trend, and treating counter-trend signals with added caution, is a durable way to tilt the odds.
● Managing the trade
Use the reference entry, protective level, and measured target as a framework rather than a mandate. Staged objectives support scaling out. The decay timer helps you retire a setup that has aged past its useful window, and the conflict warning helps you avoid committing when the structure is contested.
● Automation
Alerts can be dispatched as structured messages carrying the entry, protective level, and target, with configurable action labels — supporting hands-off routing to compatible automation endpoints while keeping the trader in control of the logic.
● Workflows the tool supports
- Breakout trading — Identify qualifying formations and act on confirmed, participation-backed breaks.
- Structure screening — Scan across symbols for clean, high-grade setups using the quality and cleanliness reads.
- Context confirmation — Overlay the volume profile on any existing method to confirm whether price is entering or leaving acceptance.
- Trend-aligned continuation — Filter continuation patterns through higher-timeframe bias.
⚙️ Inputs and Settings
● Core Settings
- Pattern Cooldown (Bars) — Minimum spacing between fresh pattern displays, preventing rapid-fire repetition.
- Symmetry Tolerance (%) — How balanced a formation must be to qualify; tighter values demand more symmetric structures.
- Min Pattern Size (% of Price) — Rejects formations too small relative to price.
- Min Pattern Size (ATR Multiplier) — Rejects formations too small relative to prevailing volatility.
- Max Patterns Displayed — Caps how many formations appear at once, keeping the chart focused.
● Patterns
- Bullish Flag / Bearish Flag — Toggle detection of flag continuations.
- Bullish Pennant / Bearish Pennant — Toggle detection of pennant continuations.
- Rising Wedge / Falling Wedge — Toggle detection of wedge formations.
- Triangle — Toggle detection of converging triangle ranges.
● Pivot
- Pivot Lookback Left / Right — Define how prominent a swing must be to count as a structural point; larger values yield fewer, more significant pivots.
- Max Pivots to Remember — How many structural points the tool retains for its analysis.
● Filters
- Require Candle Close Outside? — Demand a close beyond a boundary to confirm a break.
- Require Full Body Breakout? — Demand a full candle body beyond the boundary.
- Use ATR for Threshold? — Base breakout distance on volatility rather than a fixed percentage.
- Breakout Threshold (ATR) / (%) — How far beyond a boundary price must travel to confirm.
- Confirmation Bars (Consecutive) — Require the break to hold across a number of bars.
- Show Patterns Without Confirmation — Optionally display unconfirmed formations.
- Scan Lookback Bars — How far back the breakout scan reaches.
- Require Volume Spike? — Demand elevated participation on the break.
- Volume Multiplier / Volume SMA Length — Define what counts as a participation surge and the baseline it is measured against.
- Min Risk:Reward Ratio — Suppress setups whose payoff does not justify their risk.
- Slippage (Ticks) / Commission (%) — Fold realistic friction into the risk-to-reward read.
● Visuals
- Fill Transparency — Opacity of pattern fills.
- Show Measured Targets — Toggle the projected objective.
- Stop Loss ATR Buffer — Volatility cushion added to the protective level.
- SL as % of Target Dist / SL % of Target Dist — Alternatively size protection as a fraction of the target distance.
- Extend Breakout Lines — Project boundary lines forward.
- Custom Label Scaling / Label Size — Control label sizing.
- Freeze Current Pattern — Lock the active formation in place for study.
● Volume Profile
- Show Volume Profile — Toggle the histogram.
- Row Size — Granularity of the profile; more rows yield finer resolution.
- Profile Width (%) — Horizontal extent of the histogram.
- Highlight POC Row — Emphasise the control level.
- Show Value Area / Value Area (%) — Toggle and define the balance band.
- Show VAH/VAL/POC Lines — Draw boundary and control reference lines.
● Dashboard
- Dashboard Position — Anchor the panel to any corner.
- Normalized ATR Display — Present volatility in normalised terms.
● Pattern Intelligence
- Pattern Quality Score — Enable the composite grade.
- Multi-Pattern Confluence — Enable agreement tracking.
- Pattern Heatmap Score — Enable the consolidated temperature read.
- Higher Timeframe Bias / HTF Timeframe — Enable trend alignment and choose the reference timeframe.
- Neckline Strength Decay / Neckline Touch Tolerance (ATR) — Enable boundary-respect tracking and set its sensitivity.
- Pattern Cleanliness Score — Enable the tidiness read.
- Cross-Pattern Conflict Warning — Enable contested-structure warnings.
- Formation Speed Score — Enable the pace read.
- Pattern Decay Timer / Decay Timer Multiplier — Enable the validity countdown and set its horizon.
- Multiple TP Levels / TP1–TP3 % of Target Dist — Enable staged objectives and place each level.
● Alerts
- Enable Alerts — Toggle alert dispatch.
- Dynamic R:R Multiplier / R:R Multiplier — Optionally scale the target relationship.
- Long / Short / Close Long / Close Short Action — Configurable labels injected into outgoing alert messages for automation routing.
● Colors
- Full colour customisation — Directional hues, entry, protective, and target lines, staged target colours, dashboard styling, volume-profile shading, and score palettes are all user-configurable.
🔍 Deconstruction of the Underlying Scientific and Academic Framework
● Classical chart pattern theory
The formation vocabulary at the heart of this tool descends directly from the foundational literature of technical analysis. The systematic treatment of flags, pennants, wedges, and triangles as continuation and reversal structures traces to Edwards and Magee's Technical Analysis of Stock Trends, the canonical reference that formalised pattern classification, and to the statistical cataloguing of pattern behaviour in the work of Thomas Bulkowski. The practice of projecting a measured objective from a pattern's own dimensions is a direct inheritance from this tradition.
● Auction market theory and volume at price
The volume-profile component rests on the auction-market framework developed by J. Peter Steidlmayer and elaborated in the Market Profile literature by Jim Dalton. Central to this view is the idea that markets seek areas of value through a continuous two-sided auction, that the point of greatest accepted activity acts as a reference around which price rotates, and that the value area delineates the zone of perceived fair pricing. Reading structure against these acceptance and rejection zones grounds pattern signals in participation rather than price alone.
● Volatility normalisation
The tool's reliance on a volatility measure to scale size thresholds, protective buffers, and boundary tolerances reflects the enduring influence of J. Welles Wilder's introduction of Average True Range in New Concepts in Technical Trading Systems. Normalising structural judgments to prevailing volatility allows the same logic to behave consistently across instruments and regimes.
● Trend context and multi-timeframe alignment
The higher-timeframe bias filter operationalises the long-standing principle — articulated across the works of Charles Dow and later trend theorists — that signals aligned with the dominant trend of a larger degree carry a structural advantage. Reading a lower-timeframe setup through the lens of a higher-timeframe lean is a formalisation of top-down analysis.
● Participation confirmation
The optional requirement that breakouts be accompanied by elevated activity reflects the classical volume-confirmation doctrine, a thread running from the earliest Dow-theory writings through Joseph Granville's work on volume as a leading indicator of price. The premise is simple and durable: conviction leaves a footprint in participation.
● Risk-adjusted evaluation
The insistence on a realistic risk-to-reward read that folds in transaction friction echoes the broader discipline of risk-adjusted performance evaluation. Just as the study of returns is meaningless without the study of the risk taken to earn them, a pattern signal is incomplete without an honest accounting of its payoff geometry and the frictional costs of acting on it.
⚠️ Disclaimer
This tool is provided for educational and informational purposes only. It does not constitute financial, investment, or trading advice, nor a recommendation to buy, sell, or hold any instrument. Chart patterns, volume analysis, and the derived scores are analytical aids, not forecasts; markets are inherently uncertain and no method can predict future price movement. Past behaviour of any pattern or signal is not a reliable indicator of future results. All trading involves substantial risk of loss, and you are solely responsible for your own decisions and their outcomes. Test any approach thoroughly and consider consulting a licensed professional before committing capital. We accept no liability for any loss or damage arising from the use of this tool.
ملاحظات الأخبار
Live Trade Level Status TrackingStop, Target, and TP1/TP2/TP3 lines no longer sit static once drawn. As price interacts with each level, its label updates in place to show that it has been hit, along with the resulting percentage gain or loss from entry.
How to Use
- Watch the Entry, Stop, and Target labels on the active trade drawing — once a level is touched, its label switches to a "HIT" state with a live percentage result.
- This lets you see at a glance whether a signal's stop was hit first or whether it progressed through TP1, TP2, and TP3 before final target.
Signal Lock Status on Dashboard
The dashboard now includes a dedicated row showing whether Signal Lock is currently active, so you no longer need to check the settings panel to confirm lock state while watching the chart.
How to Use
- Check the new "Lock" row near the top of the dashboard — it displays ACTIVE or OFF depending on whether the current signal is frozen in place.
Refinements
- "Bars Since Brk" now counts from the actual breakout bar rather than the detection bar, giving a more accurate read on trade age
- Dashboard rows reordered for a more logical top-to-bottom flow (Lock, Bias, Active Pattern, ATR, Vol Spike, R:R, Pivot Depth, then Bars Since Brk)
- Dashboard label column now uses a distinct muted color, improving readability against value columns
- Improved pattern quality and confluence scoring stability across a wider range of chart conditions
- Higher Timeframe Bias requests optimized for more reliable data alignment
- Improved consistency of pattern detection, target/stop calculation, and profile rendering across long chart histories
- General accuracy improvements to entry timing, breakout scanning, and neckline touch detection
- Extended trade level lines now project further forward when Signal Lock is active
- Minor internal reorganization of input groups for improved settings navigation
ملاحظات الأخبار
Pattern & Volume Profile - Update SummaryMajor Features
- Full Trade-Lifecycle Webhook Alerts - Alerts now cover the whole trade, not just the entry. When the Stop Loss or the final Target is reached, a structured close message is sent for the active long or short position, including the pattern, the entry, the exit price and whether the exit came from the stop or the target.
- Structured Take-Profit Alerts - TP1, TP2 and TP3 hits now send structured webhook messages (direction, pattern, entry and the level reached) instead of plain text, so partial exits can be automated. Each take-profit level has its own user-defined action name in the Alerts settings.
- Faster Take-Profit Notifications - Take-profit alerts now fire as soon as price touches the level during the bar, rather than waiting for the bar to close.
- New Alert Conditions - Five new conditions are available in the alert dialog: TP1 Hit, TP2 Hit, TP3 Hit, SL Hit and Target Hit.
Minor Features
- Merged Level Labels - When two or more trade levels land on the same price, they now share one combined label instead of stacking unreadable labels on top of each other. Hit status updates on the combined label.
- Smart Trade-Level Extension - Entry, Stop, Target and TP lines now extend just past the latest bar while the trade is live, and stop extending shortly after the bar where the trade closed at the stop or the target, keeping finished trades visually contained.
- Cleanliness Gauge - The Cleanliness dashboard row now shows a color-graded gauge bar instead of a plain percentage.
- New Label Color Controls - Added separate text-color settings for trade-level labels and for hit labels.
- Readable Large Numbers - Formation Speed, Decay Timer, ATR in ticks, Bars Since Breakout and Pivot Count now abbreviate large values (thousands, millions, billions) to keep the dashboard compact.
- Readable Timeframe Header - The dashboard header now shows the chart timeframe in a trader-friendly form (for example hours and days) instead of the raw value.
Refinements
- More Accurate Flag and Pennant Poles - The pole is now measured from the section directly before the flag and must move in the pattern's direction. This produces more reliable pole sizes and projected targets, and filters out flags without a genuine directional pole.
- Out-of-Range Flags Skipped - Flags whose pole lies beyond the available history are no longer evaluated, preventing distorted targets.
- Redesigned Trade Levels - Level labels now use a solid color background with a consistent compact size. The Stop line is now solid and bolder, TP lines are dashed, and the shaded risk and reward zones between levels were removed for a cleaner chart.
- New Default Level Colors - Entry, Stop, Target and TP lines use a refreshed default palette, with TP levels shown as graduated shades of the target color.
- Pattern Lock Timing - Pattern Lock now takes effect immediately on the latest bar, so no new pattern can replace the locked one on that bar.
- Drawing Limit Protection - When the chart's drawing limit is approached, the oldest pattern drawings are removed automatically so new patterns and their fills always render.
- Symbols Without Volume - The Vol Spike score now handles symbols that provide no volume data.
- Gauge Alignment - Gauge-style dashboard rows use a font that keeps the bars evenly aligned.
Performance
- The dashboard now refreshes only on the latest bar, reducing load on long histories.
- The higher-timeframe data request only runs at the higher timeframe when HTF Bias is enabled.
- The Heatmap Score, pattern touch count, cleanliness score and volume histogram are now calculated more efficiently.
- Unused hidden boundary lines were removed, freeing drawing capacity for visible elements.
How to Use
- Combined level label - A label listing several names (for example TP3 and Target) means those levels sit at the same price. When price reaches it, the label marks all of them as hit at once.
- Level label colors - Each label's background matches its level: stop color for the stop, entry color for the entry, and target shades for the take-profit levels. A combined label takes the color of the furthest level it contains, except when it includes the stop, which always shows in the stop color.
- Cleanliness gauge - A fuller, brighter bar means the pattern's structure is cleaner and better defined; a short, dim bar means a noisier formation that deserves more caution.
- Where lines stop - Level lines that end shortly after a past bar mark a trade that has already closed at its stop or target; lines reaching just past the latest bar belong to a trade that is still live.
ملاحظات الأخبار
Pattern & Volume Profile — Update SummaryMajor Improvements
- Stop-loss confirmed on close — A stop is now registered only when a bar closes beyond it, not on a passing wick, so brief spikes no longer end valid trades. The hit label shows the actual exit.
- Clean trade hand-over — When a new pattern appears while a trade is still open, the open trade is closed and marked as a Reversal (opposite direction) or Replaced (same direction), with matching close alerts, so conflicting trades are never carried at the same time.
- Entry reflects the signal moment — The entry level now matches the price at the moment the signal fires and the alert is sent, keeping chart, dashboard and alerts aligned.
- Higher-timeframe bias rebuilt — The dashboard now shows the real higher-timeframe state (Bull, Bear or Flat) together with its timeframe. No signal passes while the higher timeframe is still loading, and a timeframe below the chart's is skipped and flagged instead of stopping the indicator.
- Ordered profit targets — TP1, TP2, TP3 and the final Target are always arranged nearest to farthest, so the final target is always the level that closes the trade. A dashboard notice appears when your settings were reordered.
- Pattern Quality Score redesigned — The score now rates each setup on its reward potential and the participation behind its breakout, and adapts automatically on symbols that report no volume.
New Features
- Pine Screener columns — The indicator now feeds the Pine Screener with these columns: Direction, Bars Since Signal, Entry, Stop, TP1, TP2, TP3, Targets Hit and Trade Active. The Pine Screener is available on TradingView Premium and Ultimate plans only and calculates on the most recent 500 bars. The columns show the trade's levels as it opened — the same levels its alerts send.
- Live trade panel — New dashboard rows show the Trade State together with the Entry, Stop and Target or TP levels of the current trade.
- Filter status rows — Each active filter (Close Outside, Full Body, Confirmation Bars, Volume Filter, Min R:R, HTF Bias) now reports whether the last signal passed it or whether it was skipped.
- Volume Profile levels on the dashboard — The POC, VAH and VAL prices of the last pattern now appear on the dashboard, with a notice when the profile was skipped or only partly built.
- Partial-close webhook actions — TP1, TP2 and TP3 hits now send dedicated Partial Close Long / Partial Close Short action words and include the stop level; the final target sends the regular close action. Update any automation that expected the previous TP action words.
- Show Dashboard toggle — Hide the dashboard entirely when you want a clean chart.
- Settings tooltips — Nearly every setting now carries a tooltip explaining what it does.
Refinements
- Stricter pattern validation — The minimum pattern size now applies to flags, pennants and wedges as well as triangles, and pennants must genuinely converge. Trade levels on the wrong side of entry or below zero are rejected, including when Show Patterns Without Confirmation is on.
- Symbols without volume — Volume-based filters and the profile are skipped and clearly marked as skipped instead of producing misleading readings; the volume average ignores bars that carry no volume.
- Hits evaluated after the signal — Targets and stop are tracked from the bar after the signal, and a target reached on the same bar takes priority over the stop.
- Faster target alerts — Target Hit alerts now fire as soon as price reaches the target instead of waiting for the bar to close.
- Consistent alert payloads — Close messages now report direction as long or short and send the actual exit price on stops; custom action words are safely handled; no duplicate close message is sent when a trade is replaced. Review webhook automations that read the direction field.
- Clearer dashboard readings — Vol Spike and R:R Quality now show exact values instead of bars; the Pivot Depth row was removed; Pivot Count, Neckline Strength, Cleanliness and profile rows mark "(capped)" when a limit is reached; Formation Speed no longer compares against an average that does not exist yet.
- Tidier layout — Compact header, no empty gaps for disabled rows, highlighted warning rows, unified text colouring, cleaner level labels (R:R now lives on the dashboard) and hit labels at full opacity.
- Settings panel reorganised — Pivot memory now sits under Core Settings, the higher-timeframe bias under Filters, and profile display options plus Max Patterns Displayed under Visuals. Redundant colour options and custom label scaling were removed, and input ranges are now bounded.
- Number formatting — Large numbers round cleanly across thousand, million and billion boundaries.
Performance
- Dashboard calculations now run only on the latest bar, reducing load on long chart histories.
- The profile row range is capped to keep pattern drawings within the chart's drawing budget.
How to Use
- Trade State — Open while the trade is running; otherwise shows how it ended: Stop, Target, Reversal or Replaced.
- Filter rows — Passed means the last signal cleared that filter. Volume Filter and Min R:R show the signal's reading next to your setting, in the high colour when met and the low colour when not. Skipped means the filter did not apply.
- HTF Bias — Bull, Bear or Flat for the timeframe shown in the row label; Skipped when the chosen timeframe is below the chart's.
- Highlighted rows — A shaded row is a warning: a skipped setting, a capped reading, reordered targets or a partial profile.
- POC, VAH and VAL rows — The highest-volume price and the value area bounds inside the last pattern; "(capped)" means the profile covers only the most recent part of the pattern.
- Pine Screener columns — Direction reads 1 for long and -1 for short; Trade Active reads 1 while the trade is open and 0 once closed; Targets Hit counts the targets reached so far.
Settings Reset Notice
After this update your saved settings for this indicator will return to their defaults, so please re-enter them once the update is applied.
Moved to a new section: Max Pivots to Remember, Higher Timeframe Bias, HTF Timeframe, Max Patterns Displayed, Profile Width (%), Highlight POC Row, Show Value Area, Show VAH/VAL/POC Lines.
New: Show Dashboard, Partial Close Long Action, Partial Close Short Action, Dashboard Warning.
Removed: Custom Label Scaling, Label Size, TP1 Action, TP2 Action, TP3 Action, Neutral Text Color, ATR Text Color, Info Text Color, Dashboard Alt Row BG.
ملاحظات الأخبار
Pattern & Volume Profile — Update SummaryMajor Improvements
- Patterns without a valid trade are now drawn — when a pattern forms but its levels cannot make a sound trade, it now appears on the chart without trade levels instead of disappearing, so you still see the structure. This also covers a Dynamic R:R target that would produce an impossible price.
- An open trade's pattern stays on the chart — the drawing behind an active trade is now kept until that trade closes, even as newer patterns arrive. With one pattern displayed, a newer pattern without a trade appears beside it.
- Cleaner trade levels — SL, Entry, TP and Target lines now start at the bar the pattern is confirmed on, so nothing is drawn on bars before the signal.
- Truer Neckline Strength — touches are now counted on the pattern boundary that actually broke, following its slope, rather than on a flat price level.
- Truer Cleanliness Score — the score now judges price against the whole pattern channel, so closes that stay inside the pattern are no longer penalised.
- No more double close signals — when a trade closes at its stop or target on the same bar a new opposite signal fires, only one close is sent, and a same-direction pattern on that bar no longer reopens a trade at once.
- Safe on non-standard charts — on Heikin Ashi, Renko and other synthetic chart types, the indicator now shows a clear on-chart notice instead of stopping with an error.
New Features
- Plot Levels in Past — new option to start the trade level lines at the breakout bar, as in earlier versions.
- Warnings with the dashboard hidden — with Show Dashboard off, active warning rows still appear in its place, so important notices are never missed.
- Patterns Shown row — a new dashboard warning tells you when fewer patterns are on the chart than requested, or when the latest one could not be drawn, because the chart's drawing limit was reached.
- Profile Rows row — a new dashboard warning shows when a narrow pattern uses fewer profile rows than set, so no row is thinner than one price tick.
- Heatmap colour settings — two new settings, Bar: Low End and Bar: High End, shade the Heatmap Score smoothly from low to high.
Refinements
- HTF Bias row — now shows whether the last signal passed the higher-timeframe filter, or that the filter was skipped, instead of the higher timeframe's direction.
- Confluence row — now shows the plain number of pattern types found on the same bar instead of a progress bar.
- Heatmap Score — more accurate on the earliest bars, and shows a dash instead of a misleading zero until enough history exists.
- Conflict Check — Conflict and No Conflict now use the dashboard's progress-bar colours.
- Volume Profile accuracy — bars with no price range now add their volume to the profile instead of being left out.
- Consistent label colours — SL, Entry, TP3 and Target labels, including their HIT state, now always show their colour at full opacity.
- More robust pivots — pivot detection now ignores missing price data instead of misreading it.
- Very long patterns — patterns that begin far back in history are now drawn correctly.
- Tick charts — the dashboard header now labels tick-based timeframes correctly.
- Webhook reliability — symbol and timeframe text in webhook messages is now safely formatted, so unusual symbol names cannot break a message.
- Cleaner dashboard — decorative icons removed from dashboard values and from the Lock Signal setting, and the dashboard now uses the chart's standard font.
- Clearer tooltips — tooltips across the panel now explain what each option does and what switching it off removes.
Performance
- Each Pattern Intelligence option now stops its calculations entirely when switched off, so the indicator runs lighter with fewer features enabled.
- Higher-timeframe data is no longer requested while the bias filter is off.
- Several calculations now run only when a new signal or a target hit needs them, reducing work on every bar.
How to Use
- Patterns Shown — appears only as a warning; it shows how many of the requested patterns are on the chart, or that the latest one was not drawn, because of the chart's drawing limit.
- Profile Rows — appears only as a warning; it shows how many profile rows were used against your setting when a pattern is too narrow for all of them.
- HTF Bias — Passed means the last signal agreed with the higher timeframe; Skipped means the chosen timeframe is below the chart's and the filter was not applied.
- Heatmap Score colour — the closer the colour is to the High End colour, the larger the share of up-closes in the recent window.
- Standard chart notice — a red message in the middle of the chart means the chart type shows synthetic prices; switch to candles to use the indicator.
Settings Reset Notice
This update changes the settings panel, so your saved settings for this indicator will return to their defaults; please re-enter them after updating. The affected settings are:
- Trade Tools — Lock Signal (renamed).
- Visuals — Plot Levels in Past (new), Extend Breakout Lines, Fill Transparency, Profile Width (%), Highlight POC Row, Show Value Area, Show VAH/VAL/POC Lines, Max Patterns Displayed.
- Dashboard — Show Dashboard, Dashboard Position, Normalized ATR Display.
- Alerts — Enable Alerts, Long Action, Short Action, Close Long Action, Close Short Action, Partial Close Long Action, Partial Close Short Action.
- Colors — Bullish Color, Bearish Color, Entry Line Color, Stop Line Color, Target Line Color, TP1 Line Color, TP2 Line Color, TP3 Line Color, Bull Bias Color, Bear Bias Color, Bar: High, Bar: Mid, Bar: Low, Pattern Label BG, Pattern Label Text, VP Label Text, Level Label Text, Hit Label Text, VP: Low Volume, VP: High Volume, VP: POC Row, VP: Value Area Fill, VP: VAH/VAL Lines, Dashboard BG, Dashboard Text, Dashboard Header BG, Dashboard Border, Dashboard Frame, Dashboard Warning, Bar: Low End (new), Bar: High End (new).

💡 Proprietary indicators. Original research. Built by analysts who trade.
📢 Free Telegram: t.me/MarkitTick_Updates
👑 Premium: TradingView Marketplace
📘 Guides: markittick.com
📢 Free Telegram: t.me/MarkitTick_Updates
👑 Premium: TradingView Marketplace
📘 Guides: markittick.com
إخلاء المسؤولية
لا يُقصد بالمعلومات والمنشورات أن تكون، أو تشكل، أي نصيحة مالية أو استثمارية أو تجارية أو أنواع أخرى من النصائح أو التوصيات المقدمة أو المعتمدة من TradingView. اقرأ المزيد في شروط الاستخدام.
💡 Proprietary indicators. Original research. Built by analysts who trade.
📢 Free Telegram: t.me/MarkitTick_Updates
👑 Premium: TradingView Marketplace
📘 Guides: markittick.com
📢 Free Telegram: t.me/MarkitTick_Updates
👑 Premium: TradingView Marketplace
📘 Guides: markittick.com
إخلاء المسؤولية
لا يُقصد بالمعلومات والمنشورات أن تكون، أو تشكل، أي نصيحة مالية أو استثمارية أو تجارية أو أنواع أخرى من النصائح أو التوصيات المقدمة أو المعتمدة من TradingView. اقرأ المزيد في شروط الاستخدام.