OPEN-SOURCE SCRIPT
Shannon Entropy Terrain 3D [LliterH]
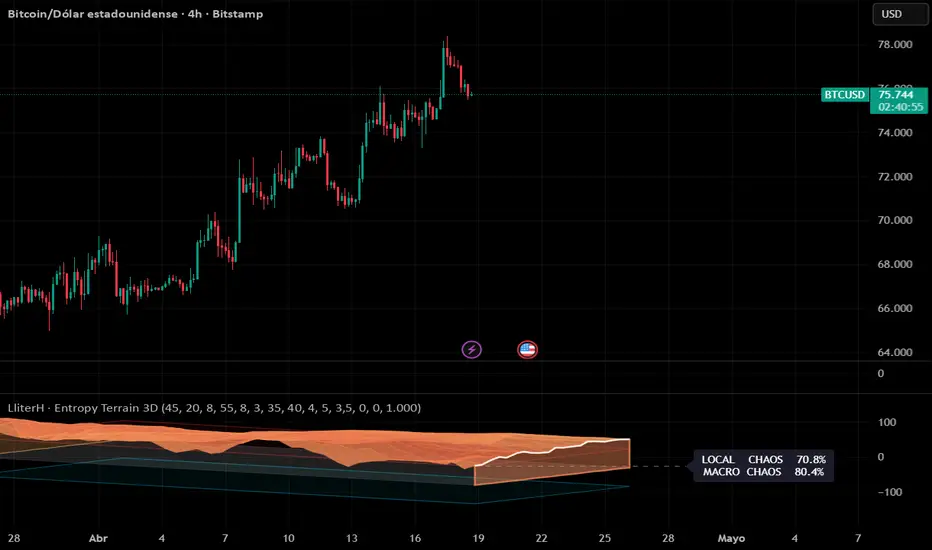
SHANNON ENTROPY TERRAIN 3D [LliterH]
─────────────────────────────────────────────────────────────────────
Most market regime filters give you a single number. This indicator gives
you a landscape.
Shannon Entropy of price log-returns is computed simultaneously across
20 different lookback windows and rendered as a 3D thermal terrain surface.
Each layer of that surface answers the same question with a different time
horizon: is the market currently structured or random?
The result is a visual map that reveals what a flat oscillator cannot —
whether the order or chaos you see in one timeframe is isolated or systemic.
THE MATHEMATICS
─────────────────────────────────────────────────────────────────────
Shannon Entropy quantifies the unpredictability of a system:
Pine Script®
Applied to the distribution of price log-returns ln(close/close[1]) over
a rolling window, H measures how randomly recent price behavior has been
distributed — independent of direction or magnitude.
This indicator normalizes H to a 0-100 scale using:
Pine Script®
where N is the number of histogram bins. Result interpretation:
0 Perfect order One directional move dominates the window
30 Order boundary Market is structured, patterns are reliable
50 Neutral plane Mixed regime, no clear consensus
70 Chaos boundary Market begins to lose predictability
100 Maximum chaos Returns distributed uniformly at random
READING THE TERRAIN
─────────────────────────────────────────────────────────────────────
The surface is colored by entropy VALUE at each point, not by depth.
This means color always communicates information — not decoration.
Deep navy to cyan Entropy 0-30 Order zone
Cyan to warm yellow Entropy 30-50 Transitioning toward order
Yellow to orange Entropy 50-70 Transitioning toward chaos
Orange to crimson Entropy 70-100 Chaos zone
Two floating wireframe rectangles mark the critical thresholds:
Cyan frame at 30 The order boundary
Red frame at 70 The chaos boundary
When the terrain surface breaches a frame, the market has crossed a
regime threshold across that lookback range.
The left wall shows the entropy profile of the oldest bar in view.
The right wall shows the live entropy profile of the current bar.
The label at the right edge displays two readings:
LOCAL Short lookback layer — fast, reactive to recent bars
MACRO Long lookback layer — slow, structural regime
PRACTICAL READING GUIDE
─────────────────────────────────────────────────────────────────────
The most valuable insight this indicator provides is CONSENSUS.
SCENARIO 1 — All layers cold (terrain below neutral plane, blue-cyan)
The market is ordered across every time horizon simultaneously.
Short lookback and long lookback agree: structure is present.
This is the highest-conviction environment for any systematic strategy.
Trend-following entries have high reliability. Range plays are clean.
Set-and-forget methodology works in this condition.
SCENARIO 2 — All layers hot (terrain above 70% frame, orange-red)
The market is noisy across every time horizon simultaneously.
No lookback window finds structure. Returns are near-random.
Breakouts are likely false. Stop hunts increase in frequency.
The correct response is to reduce position size or stand aside.
This condition often precedes or follows major news events.
SCENARIO 3 — Front cold, back cold (local and macro both ordered)
The strongest structural signal. The market has been trending
long enough for even the longer lookback windows to confirm order.
This is the ideal session condition for a London momentum setup.
SCENARIO 4 — Front hot, back cold (local chaos, macro structure)
A brief disruption within a structurally ordered trend.
The long-term framework is intact. The short-term is noisy.
Wait for the front layers to cool before entering.
The entry timing is off, but the directional bias may still be valid.
SCENARIO 5 — Front cold, back hot (local order, macro chaos)
A short-term window of clarity within a chaotic structural backdrop.
Trade with reduced size. The macro environment does not support
clean follow-through. Tighter management required.
SCENARIO 6 — Terrain crossing the 70% frame in real time
Watch the right wall and the label. When the LOCAL reading crosses
above 70 during a trade, consider whether the entry signal was
generated during the chaos or before it. If after — reassess.
HOW THIS BENEFITS YOUR TRADING
─────────────────────────────────────────────────────────────────────
The fundamental problem in discretionary trading is not finding signals —
it is knowing which signals to trust on a given day.
A strategy with a 60% win rate in ordered markets may drop to 40% in
chaotic markets. The signal logic does not change. The market regime does.
This indicator addresses that problem directly by:
1. Showing regime quality BEFORE you look for an entry. If the terrain
is red before your session opens, the day is compromised before it
starts. You know this at 3:00 AM, not after two losing trades.
2. Showing whether the regime is LOCAL or SYSTEMIC. A brief spike in
local entropy during an otherwise ordered session is different from
full-spectrum chaos. The terrain makes this distinction visual and
immediate.
3. Providing a historical map of the last 45 bars. You can see when
the chaos started, whether it is intensifying or resolving, and how
the current bar relates to the recent structural pattern.
4. Operating independently of direction. It does not tell you to buy
or sell. It tells you whether the environment supports the signals
your system generates. This separation is intentional and correct.
PARAMETERS
─────────────────────────────────────────────────────────────────────
Terrain
Time History (Width) Bars displayed on X axis. Default 45.
Entropy Layers (Depth) Lookback windows on Y axis. Default 18.
Min Lookback (Front) Shortest window. Most reactive. Default 8.
Max Lookback (Back) Longest window. Most structural. Default 55.
Histogram Bins Entropy resolution. Default 10.
Terrain Smoothing EMA smoothing per layer. Default 4.
Camera
Yaw Rotates the landscape left or right.
Pitch Tilts the viewing angle up or down.
Scale X, Y, Z Stretch each axis independently.
Offset X, Y Reposition the terrain within the pane.
Style
Wireframe Grid overlay on or off.
Surface Fill Filled terrain on or off.
Side Walls Left and right entropy profile panels.
Threshold Contour Frames 30% and 70% floating reference frames.
Thermal palette All five color anchors are adjustable.
METHODOLOGY
─────────────────────────────────────────────────────────────────────
Input signal: natural log returns ln(close/close[1]).
Log returns are scale-independent, symmetric, and stationary — the
mathematically correct input for entropy analysis of financial time series.
Histogram method: returns are binned into N equal-width intervals over
the lookback window. Probabilities are relative frequencies. This is a
direct implementation of Shannon's discrete entropy formula.
Normalization: H divided by log2(N), the theoretical maximum entropy for
N equiprobable bins. Output is always bounded in [0, 100].
Thermal color: each strip is colored by the mean entropy of its two
constituent rows, not by its position in the Y axis. Color always
encodes information value, not spatial location.
Rendering: all drawing is performed exclusively on the last bar.
The terrain matrix updates incrementally every bar for efficiency.
WHAT MAKES THIS DIFFERENT
─────────────────────────────────────────────────────────────────────
Existing 3D terrain indicators color by depth (Y axis position).
That choice is arbitrary — the color tells you where you are in the
structure, not what the data says at that point.
This indicator colors by entropy value (Z axis). The thermal gradient
is a direct encoding of the measurement. You read regime from color
without consulting a separate legend.
The floating threshold frames at 30% and 70% are 3D reference planes
that the terrain can physically breach. This is not available in any
other published terrain indicator.
The side wall panels render the full entropy distribution across all
lookback layers at a single point in time, functioning as entropy
histograms projected in 3D space.
Shannon Entropy applied to multi-lookback terrain is, to the author's
knowledge, not represented in the published TradingView library.
LIMITATIONS
─────────────────────────────────────────────────────────────────────
This indicator measures regime quality, not direction. It does not
generate buy or sell signals and should be used alongside a complete
entry methodology.
Histogram entropy with lookback windows below 8 bars approaches the
Nyquist sampling limit and produces unreliable readings. The minimum
lookback is constrained to 5 bars as a safeguard.
Performance: the indicator is computationally intensive for TradingView's
rendering engine. If responsiveness is slow, reduce Entropy Layers and
Time History. Recommended maximums: 20 layers, 55 bars width.
█ DISCLAIMER
This indicator is provided for educational and informational purposes only. It does not constitute financial, investment, or trading advice. Past performance is not indicative of future results. Trading involves substantial risk of loss and is not suitable for every investor. Always conduct your own research and consult a qualified financial professional before making any trading decisions. The author is not responsible for any losses incurred from the use of this tool
─────────────────────────────────────────────────────────────────────
Published under Mozilla Public License 2.0
© LliterH
─────────────────────────────────────────────────────────────────────
─────────────────────────────────────────────────────────────────────
Most market regime filters give you a single number. This indicator gives
you a landscape.
Shannon Entropy of price log-returns is computed simultaneously across
20 different lookback windows and rendered as a 3D thermal terrain surface.
Each layer of that surface answers the same question with a different time
horizon: is the market currently structured or random?
The result is a visual map that reveals what a flat oscillator cannot —
whether the order or chaos you see in one timeframe is isolated or systemic.
THE MATHEMATICS
─────────────────────────────────────────────────────────────────────
Shannon Entropy quantifies the unpredictability of a system:
Applied to the distribution of price log-returns ln(close/close[1]) over
a rolling window, H measures how randomly recent price behavior has been
distributed — independent of direction or magnitude.
This indicator normalizes H to a 0-100 scale using:
where N is the number of histogram bins. Result interpretation:
0 Perfect order One directional move dominates the window
30 Order boundary Market is structured, patterns are reliable
50 Neutral plane Mixed regime, no clear consensus
70 Chaos boundary Market begins to lose predictability
100 Maximum chaos Returns distributed uniformly at random
READING THE TERRAIN
─────────────────────────────────────────────────────────────────────
The surface is colored by entropy VALUE at each point, not by depth.
This means color always communicates information — not decoration.
Deep navy to cyan Entropy 0-30 Order zone
Cyan to warm yellow Entropy 30-50 Transitioning toward order
Yellow to orange Entropy 50-70 Transitioning toward chaos
Orange to crimson Entropy 70-100 Chaos zone
Two floating wireframe rectangles mark the critical thresholds:
Cyan frame at 30 The order boundary
Red frame at 70 The chaos boundary
When the terrain surface breaches a frame, the market has crossed a
regime threshold across that lookback range.
The left wall shows the entropy profile of the oldest bar in view.
The right wall shows the live entropy profile of the current bar.
The label at the right edge displays two readings:
LOCAL Short lookback layer — fast, reactive to recent bars
MACRO Long lookback layer — slow, structural regime
PRACTICAL READING GUIDE
─────────────────────────────────────────────────────────────────────
The most valuable insight this indicator provides is CONSENSUS.
SCENARIO 1 — All layers cold (terrain below neutral plane, blue-cyan)
The market is ordered across every time horizon simultaneously.
Short lookback and long lookback agree: structure is present.
This is the highest-conviction environment for any systematic strategy.
Trend-following entries have high reliability. Range plays are clean.
Set-and-forget methodology works in this condition.
SCENARIO 2 — All layers hot (terrain above 70% frame, orange-red)
The market is noisy across every time horizon simultaneously.
No lookback window finds structure. Returns are near-random.
Breakouts are likely false. Stop hunts increase in frequency.
The correct response is to reduce position size or stand aside.
This condition often precedes or follows major news events.
SCENARIO 3 — Front cold, back cold (local and macro both ordered)
The strongest structural signal. The market has been trending
long enough for even the longer lookback windows to confirm order.
This is the ideal session condition for a London momentum setup.
SCENARIO 4 — Front hot, back cold (local chaos, macro structure)
A brief disruption within a structurally ordered trend.
The long-term framework is intact. The short-term is noisy.
Wait for the front layers to cool before entering.
The entry timing is off, but the directional bias may still be valid.
SCENARIO 5 — Front cold, back hot (local order, macro chaos)
A short-term window of clarity within a chaotic structural backdrop.
Trade with reduced size. The macro environment does not support
clean follow-through. Tighter management required.
SCENARIO 6 — Terrain crossing the 70% frame in real time
Watch the right wall and the label. When the LOCAL reading crosses
above 70 during a trade, consider whether the entry signal was
generated during the chaos or before it. If after — reassess.
HOW THIS BENEFITS YOUR TRADING
─────────────────────────────────────────────────────────────────────
The fundamental problem in discretionary trading is not finding signals —
it is knowing which signals to trust on a given day.
A strategy with a 60% win rate in ordered markets may drop to 40% in
chaotic markets. The signal logic does not change. The market regime does.
This indicator addresses that problem directly by:
1. Showing regime quality BEFORE you look for an entry. If the terrain
is red before your session opens, the day is compromised before it
starts. You know this at 3:00 AM, not after two losing trades.
2. Showing whether the regime is LOCAL or SYSTEMIC. A brief spike in
local entropy during an otherwise ordered session is different from
full-spectrum chaos. The terrain makes this distinction visual and
immediate.
3. Providing a historical map of the last 45 bars. You can see when
the chaos started, whether it is intensifying or resolving, and how
the current bar relates to the recent structural pattern.
4. Operating independently of direction. It does not tell you to buy
or sell. It tells you whether the environment supports the signals
your system generates. This separation is intentional and correct.
PARAMETERS
─────────────────────────────────────────────────────────────────────
Terrain
Time History (Width) Bars displayed on X axis. Default 45.
Entropy Layers (Depth) Lookback windows on Y axis. Default 18.
Min Lookback (Front) Shortest window. Most reactive. Default 8.
Max Lookback (Back) Longest window. Most structural. Default 55.
Histogram Bins Entropy resolution. Default 10.
Terrain Smoothing EMA smoothing per layer. Default 4.
Camera
Yaw Rotates the landscape left or right.
Pitch Tilts the viewing angle up or down.
Scale X, Y, Z Stretch each axis independently.
Offset X, Y Reposition the terrain within the pane.
Style
Wireframe Grid overlay on or off.
Surface Fill Filled terrain on or off.
Side Walls Left and right entropy profile panels.
Threshold Contour Frames 30% and 70% floating reference frames.
Thermal palette All five color anchors are adjustable.
METHODOLOGY
─────────────────────────────────────────────────────────────────────
Input signal: natural log returns ln(close/close[1]).
Log returns are scale-independent, symmetric, and stationary — the
mathematically correct input for entropy analysis of financial time series.
Histogram method: returns are binned into N equal-width intervals over
the lookback window. Probabilities are relative frequencies. This is a
direct implementation of Shannon's discrete entropy formula.
Normalization: H divided by log2(N), the theoretical maximum entropy for
N equiprobable bins. Output is always bounded in [0, 100].
Thermal color: each strip is colored by the mean entropy of its two
constituent rows, not by its position in the Y axis. Color always
encodes information value, not spatial location.
Rendering: all drawing is performed exclusively on the last bar.
The terrain matrix updates incrementally every bar for efficiency.
WHAT MAKES THIS DIFFERENT
─────────────────────────────────────────────────────────────────────
Existing 3D terrain indicators color by depth (Y axis position).
That choice is arbitrary — the color tells you where you are in the
structure, not what the data says at that point.
This indicator colors by entropy value (Z axis). The thermal gradient
is a direct encoding of the measurement. You read regime from color
without consulting a separate legend.
The floating threshold frames at 30% and 70% are 3D reference planes
that the terrain can physically breach. This is not available in any
other published terrain indicator.
The side wall panels render the full entropy distribution across all
lookback layers at a single point in time, functioning as entropy
histograms projected in 3D space.
Shannon Entropy applied to multi-lookback terrain is, to the author's
knowledge, not represented in the published TradingView library.
LIMITATIONS
─────────────────────────────────────────────────────────────────────
This indicator measures regime quality, not direction. It does not
generate buy or sell signals and should be used alongside a complete
entry methodology.
Histogram entropy with lookback windows below 8 bars approaches the
Nyquist sampling limit and produces unreliable readings. The minimum
lookback is constrained to 5 bars as a safeguard.
Performance: the indicator is computationally intensive for TradingView's
rendering engine. If responsiveness is slow, reduce Entropy Layers and
Time History. Recommended maximums: 20 layers, 55 bars width.
█ DISCLAIMER
This indicator is provided for educational and informational purposes only. It does not constitute financial, investment, or trading advice. Past performance is not indicative of future results. Trading involves substantial risk of loss and is not suitable for every investor. Always conduct your own research and consult a qualified financial professional before making any trading decisions. The author is not responsible for any losses incurred from the use of this tool
─────────────────────────────────────────────────────────────────────
Published under Mozilla Public License 2.0
© LliterH
─────────────────────────────────────────────────────────────────────
نص برمجي مفتوح المصدر
بروح TradingView الحقيقية، قام مبتكر هذا النص البرمجي بجعله مفتوح المصدر، بحيث يمكن للمتداولين مراجعة وظائفه والتحقق منها. شكرا للمؤلف! بينما يمكنك استخدامه مجانًا، تذكر أن إعادة نشر الكود يخضع لقواعد الموقع الخاصة بنا.

إخلاء المسؤولية
لا يُقصد بالمعلومات والمنشورات أن تكون، أو تشكل، أي نصيحة مالية أو استثمارية أو تجارية أو أنواع أخرى من النصائح أو التوصيات المقدمة أو المعتمدة من TradingView. اقرأ المزيد في شروط الاستخدام.
نص برمجي مفتوح المصدر
بروح TradingView الحقيقية، قام مبتكر هذا النص البرمجي بجعله مفتوح المصدر، بحيث يمكن للمتداولين مراجعة وظائفه والتحقق منها. شكرا للمؤلف! بينما يمكنك استخدامه مجانًا، تذكر أن إعادة نشر الكود يخضع لقواعد الموقع الخاصة بنا.
إخلاء المسؤولية
لا يُقصد بالمعلومات والمنشورات أن تكون، أو تشكل، أي نصيحة مالية أو استثمارية أو تجارية أو أنواع أخرى من النصائح أو التوصيات المقدمة أو المعتمدة من TradingView. اقرأ المزيد في شروط الاستخدام.