StrategyScorecard
StrategyScorecard
Overview
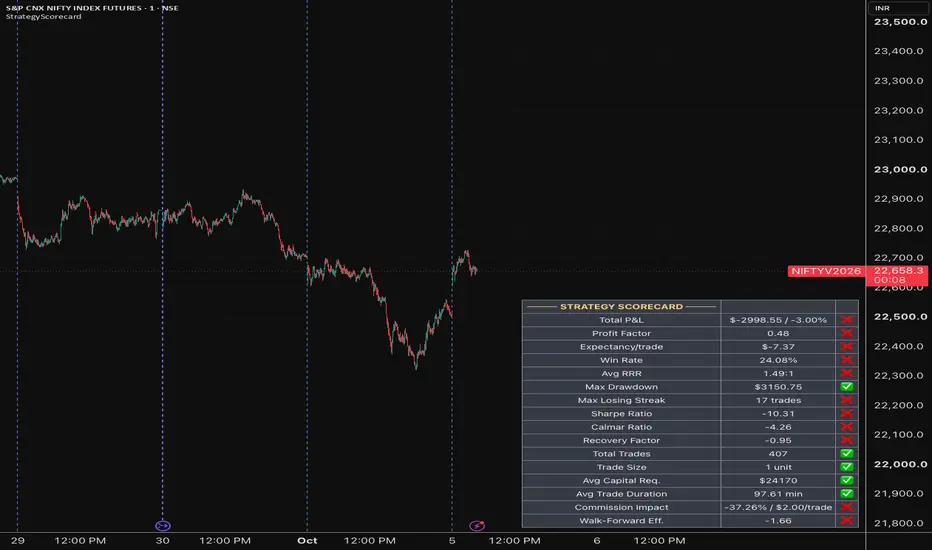
StrategyScorecard is a Pine Script v6 library that adds a compact evaluation table to any strategy: the key figures of a backtest, each with a pass / warn / fail icon, so a strategy's weak points are visible on the chart without opening the Strategy Tester.
Libraries cannot read strategy.* values, so the strategy passes its built-in figures in a Stats object and feeds its closed trades to TradeTotals. The library does the arithmetic, keeps the time-based state for the Sharpe and Calmar ratios, and draws the table.
What's inside
Quick start
Pine Script®
Notes
Demo
Add the library to a chart on its own to see a demo that uses every exported function. Because a library cannot place orders, the demo tracks a simple moving-average crossover by hand and feeds it to the scorecard.
Library "StrategyScorecard"
A strategy scorecard table: profit factor, expectancy, win rate, reward to risk, drawdown, losing streak,
Sharpe, Calmar, recovery factor, trade count, trade size, capital per trade, trade duration, commission
impact and walk-forward efficiency, each with a pass / warn / fail icon. Libraries cannot read
`strategy.*`, so the strategy passes its built-in figures in `Stats` and feeds its closed trades to
`TradeTotals.addTrade()`; `dailySharpe()` and `calmar()` keep the time-based state.
method addTrade(t, profit, commission, entryPrice, size, entryTime, exitTime, splitTime)
Adds one closed trade, e.g. `strategy.closedtrades.profit(i)` and its companions.
Namespace types: TradeTotals
Parameters:
t (TradeTotals): (TradeTotals) The totals.
profit (float): (series float) Trade profit.
commission (float): (series float) Trade commission.
entryPrice (float): (series float) Entry price.
size (float): (series float) Trade size (sign ignored).
entryTime (int): (series int) Entry time.
exitTime (int): (series int) Exit time.
splitTime (int): (series int) Walk-forward split time; `na` disables the in / out-of-sample split. Optional.
Returns: (void)
dailySharpe(equity)
Annualised Sharpe ratio of daily equity returns (no risk-free rate, 252 trading days). The current day's
return counts on the last historical bar. Call it once per bar, unconditionally.
Parameters:
equity (float): (series float) `strategy.equity`.
Returns: (float) The Sharpe ratio, or `na` with fewer than two days or no variation.
calmar(netProfitPct, maxDrawdownPct)
Calmar ratio: annualised return (or the total return during the first 30 days) over the maximum drawdown
percentage. Call it once per bar, unconditionally.
Parameters:
netProfitPct (float): (series float) `strategy.netprofit_percent`.
maxDrawdownPct (float): (series float) `strategy.max_drawdown_percent`.
Returns: (float) The Calmar ratio, or `na` while the drawdown is below 0.01%.
render(t, th, s, tt, sharpe, calmarRatio, currency, capitalStep, sizeText, showCommission, walkForward)
Draws the scorecard into a table of 3 columns and 17 rows (create it with `UIKit.newTable()`). Call it on
the last bar.
Parameters:
t (table): (table) The table.
th (Theme type from jabez4jc/UIKit/1): (UIKit.Theme) Colours and text size.
s (Stats): (Stats) The strategy's built-in figures.
tt (TradeTotals): (TradeTotals) Totals over the closed trades.
sharpe (float): (series float) From `dailySharpe()`.
calmarRatio (float): (series float) From `calmar()`.
currency (string): (series string) Currency prefix, e.g. "₹" or "$".
capitalStep (float): (series float) Rounding step of the capital-per-trade figure, e.g. 1000.
sizeText (string): (series string) Trade size description, e.g. "1 lot(s) / 65 units".
showCommission (bool): (series bool) Show the commission impact row's figures.
walkForward (bool): (series bool) Show the walk-forward efficiency row's figure.
Returns: (void)
Stats
The strategy's built-in figures.
Fields:
netProfit (series float): `strategy.netprofit`.
netProfitPct (series float): `strategy.netprofit_percent`.
grossProfit (series float): `strategy.grossprofit`.
grossLoss (series float): `strategy.grossloss`.
wins (series int): `strategy.wintrades`.
losses (series int): `strategy.losstrades`.
avgWin (series float): `strategy.avg_winning_trade`.
avgLoss (series float): `strategy.avg_losing_trade`.
avgTrade (series float): `strategy.avg_trade`.
maxDrawdown (series float): `strategy.max_drawdown`.
maxDrawdownPct (series float): `strategy.max_drawdown_percent`.
TradeTotals
Totals over the strategy's closed trades, built with `addTrade()`.
Fields:
trades (series int): Closed trades added.
commission (series float): Total commission paid.
minutes (series float): Total time in trades, in minutes.
capital (series float): Sum of entry price x size (capital committed per trade).
inSample (series float): Net profit of trades closed before the walk-forward split.
outSample (series float): Net profit of trades closed on or after the split.
streak (series int): Current losing streak.
maxLosingStreak (series int): Longest losing streak.
Overview
StrategyScorecard is a Pine Script v6 library that adds a compact evaluation table to any strategy: the key figures of a backtest, each with a pass / warn / fail icon, so a strategy's weak points are visible on the chart without opening the Strategy Tester.
Libraries cannot read strategy.* values, so the strategy passes its built-in figures in a Stats object and feeds its closed trades to TradeTotals. The library does the arithmetic, keeps the time-based state for the Sharpe and Calmar ratios, and draws the table.
What's inside
- Stats: the strategy's built-in figures (net profit and %, gross profit and loss, winning and losing trades, average win / loss / trade, maximum drawdown and %).
- TradeTotals and addTrade(): totals over the closed trades: commission, time in trades, capital committed, longest losing streak, and in-sample / out-of-sample profit around an optional walk-forward split date.
- dailySharpe(equity): annualised Sharpe ratio of daily equity returns (252 trading days, no risk-free rate).
- calmar(netProfitPct, maxDrawdownPct): annualised return (or total return during the first 30 days) over the maximum drawdown.
- render(...): draws the 16-row scorecard: Total P&L, Profit Factor, Expectancy, Win Rate, Average Reward to Risk, Max Drawdown, Max Losing Streak, Sharpe, Calmar, Recovery Factor, Total Trades, Trade Size, Average Capital, Average Trade Duration, Commission Impact and Walk-Forward Efficiency.
Quick start
Notes
- Call dailySharpe() and calmar() on every bar; build TradeTotals and render on the last bar.
- The icons use fixed rule-of-thumb thresholds (for example a profit factor of 1.5 passes, a drawdown above 30% fails). They are a quick checklist, not a judgement of whether a strategy will perform in the future.
- Uses my UIKit library for the table theme.
Demo
Add the library to a chart on its own to see a demo that uses every exported function. Because a library cannot place orders, the demo tracks a simple moving-average crossover by hand and feeds it to the scorecard.
Library "StrategyScorecard"
A strategy scorecard table: profit factor, expectancy, win rate, reward to risk, drawdown, losing streak,
Sharpe, Calmar, recovery factor, trade count, trade size, capital per trade, trade duration, commission
impact and walk-forward efficiency, each with a pass / warn / fail icon. Libraries cannot read
`strategy.*`, so the strategy passes its built-in figures in `Stats` and feeds its closed trades to
`TradeTotals.addTrade()`; `dailySharpe()` and `calmar()` keep the time-based state.
method addTrade(t, profit, commission, entryPrice, size, entryTime, exitTime, splitTime)
Adds one closed trade, e.g. `strategy.closedtrades.profit(i)` and its companions.
Namespace types: TradeTotals
Parameters:
t (TradeTotals): (TradeTotals) The totals.
profit (float): (series float) Trade profit.
commission (float): (series float) Trade commission.
entryPrice (float): (series float) Entry price.
size (float): (series float) Trade size (sign ignored).
entryTime (int): (series int) Entry time.
exitTime (int): (series int) Exit time.
splitTime (int): (series int) Walk-forward split time; `na` disables the in / out-of-sample split. Optional.
Returns: (void)
dailySharpe(equity)
Annualised Sharpe ratio of daily equity returns (no risk-free rate, 252 trading days). The current day's
return counts on the last historical bar. Call it once per bar, unconditionally.
Parameters:
equity (float): (series float) `strategy.equity`.
Returns: (float) The Sharpe ratio, or `na` with fewer than two days or no variation.
calmar(netProfitPct, maxDrawdownPct)
Calmar ratio: annualised return (or the total return during the first 30 days) over the maximum drawdown
percentage. Call it once per bar, unconditionally.
Parameters:
netProfitPct (float): (series float) `strategy.netprofit_percent`.
maxDrawdownPct (float): (series float) `strategy.max_drawdown_percent`.
Returns: (float) The Calmar ratio, or `na` while the drawdown is below 0.01%.
render(t, th, s, tt, sharpe, calmarRatio, currency, capitalStep, sizeText, showCommission, walkForward)
Draws the scorecard into a table of 3 columns and 17 rows (create it with `UIKit.newTable()`). Call it on
the last bar.
Parameters:
t (table): (table) The table.
th (Theme type from jabez4jc/UIKit/1): (UIKit.Theme) Colours and text size.
s (Stats): (Stats) The strategy's built-in figures.
tt (TradeTotals): (TradeTotals) Totals over the closed trades.
sharpe (float): (series float) From `dailySharpe()`.
calmarRatio (float): (series float) From `calmar()`.
currency (string): (series string) Currency prefix, e.g. "₹" or "$".
capitalStep (float): (series float) Rounding step of the capital-per-trade figure, e.g. 1000.
sizeText (string): (series string) Trade size description, e.g. "1 lot(s) / 65 units".
showCommission (bool): (series bool) Show the commission impact row's figures.
walkForward (bool): (series bool) Show the walk-forward efficiency row's figure.
Returns: (void)
Stats
The strategy's built-in figures.
Fields:
netProfit (series float): `strategy.netprofit`.
netProfitPct (series float): `strategy.netprofit_percent`.
grossProfit (series float): `strategy.grossprofit`.
grossLoss (series float): `strategy.grossloss`.
wins (series int): `strategy.wintrades`.
losses (series int): `strategy.losstrades`.
avgWin (series float): `strategy.avg_winning_trade`.
avgLoss (series float): `strategy.avg_losing_trade`.
avgTrade (series float): `strategy.avg_trade`.
maxDrawdown (series float): `strategy.max_drawdown`.
maxDrawdownPct (series float): `strategy.max_drawdown_percent`.
TradeTotals
Totals over the strategy's closed trades, built with `addTrade()`.
Fields:
trades (series int): Closed trades added.
commission (series float): Total commission paid.
minutes (series float): Total time in trades, in minutes.
capital (series float): Sum of entry price x size (capital committed per trade).
inSample (series float): Net profit of trades closed before the walk-forward split.
outSample (series float): Net profit of trades closed on or after the split.
streak (series int): Current losing streak.
maxLosingStreak (series int): Longest losing streak.

إخلاء المسؤولية
لا يُقصد بالمعلومات والمنشورات أن تكون، أو تشكل، أي نصيحة مالية أو استثمارية أو تجارية أو أنواع أخرى من النصائح أو التوصيات المقدمة أو المعتمدة من TradingView. اقرأ المزيد في شروط الاستخدام.
إخلاء المسؤولية
لا يُقصد بالمعلومات والمنشورات أن تكون، أو تشكل، أي نصيحة مالية أو استثمارية أو تجارية أو أنواع أخرى من النصائح أو التوصيات المقدمة أو المعتمدة من TradingView. اقرأ المزيد في شروط الاستخدام.