تم تحديثه
Bitcoin 4-Year Cycle Lookback Marker
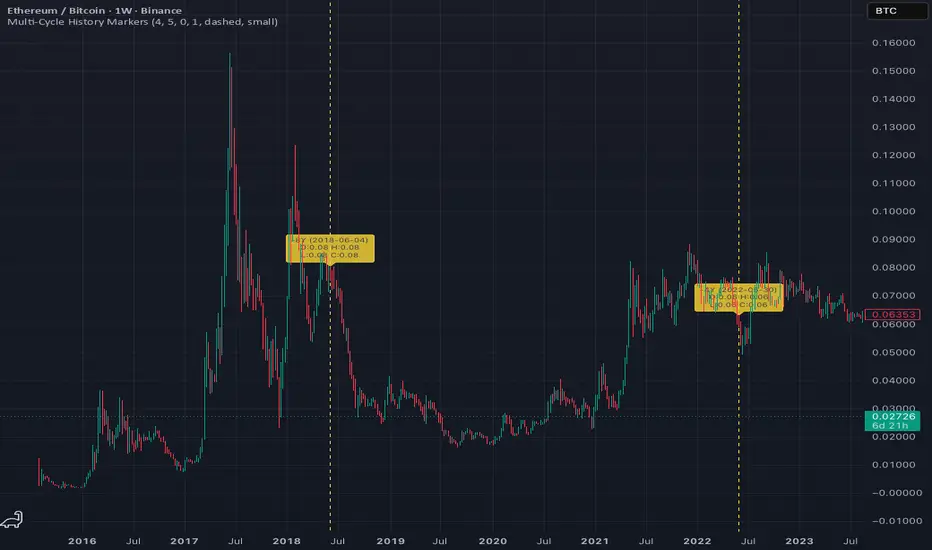
Automatically plots a vertical marker at the bar occurring exactly N years ago (default: 4 years), allowing traders and investors to quickly locate and study historical market conditions, cycle lows, cycle highs, and key events from prior Bitcoin market cycles.
Full Description:
The Bitcoin 4-Year Cycle Lookback Marker is designed for cycle analysis and historical market research.
Instead of manually scrolling through years of price action, this indicator automatically places a vertical marker on the chart at a configurable lookback period, making it easy to compare current market conditions with prior cycle stages.
Features:
• Adjustable lookback period (default 4 years)
• Fine-tuning with day offsets
• Customizable marker color, width, and style
• Optional historical price and date labels
• Works across all chart timeframes
• Designed for Bitcoin cycle and halving-cycle analysis
Common Uses:
• Identify where Bitcoin traded four years ago today
• Compare current market structure to previous cycles
• Locate historical highs, lows, consolidations, and breakouts
• Study market behavior before and after halving events
• Build data-driven cycle frameworks
This indicator is intended as a research and educational tool and does not provide trading signals or financial advice.
Full Description:
The Bitcoin 4-Year Cycle Lookback Marker is designed for cycle analysis and historical market research.
Instead of manually scrolling through years of price action, this indicator automatically places a vertical marker on the chart at a configurable lookback period, making it easy to compare current market conditions with prior cycle stages.
Features:
• Adjustable lookback period (default 4 years)
• Fine-tuning with day offsets
• Customizable marker color, width, and style
• Optional historical price and date labels
• Works across all chart timeframes
• Designed for Bitcoin cycle and halving-cycle analysis
Common Uses:
• Identify where Bitcoin traded four years ago today
• Compare current market structure to previous cycles
• Locate historical highs, lows, consolidations, and breakouts
• Study market behavior before and after halving events
• Build data-driven cycle frameworks
This indicator is intended as a research and educational tool and does not provide trading signals or financial advice.
ملاحظات الأخبار
Automatically plots a vertical marker at the bar occurring exactly N years ago (default: 4 years), allowing traders and investors to quickly locate and study historical market conditions, cycle lows, cycle highs, and key events from prior Bitcoin market cycles.Full Description:
The Bitcoin 4-Year Cycle Lookback Marker is designed for cycle analysis and historical market research.
Instead of manually scrolling through years of price action, this indicator automatically places a vertical marker on the chart at a configurable lookback period, making it easy to compare current market conditions with prior cycle stages.
Features:
• Adjustable lookback period (default 4 years)
• Fine-tuning with day offsets
• Customizable marker color, width, and style
• Optional historical price and date labels
• Works across all chart timeframes
• Designed for Bitcoin cycle and halving-cycle analysis
Common Uses:
• Identify where Bitcoin traded four years ago today
• Compare current market structure to previous cycles
• Locate historical highs, lows, consolidations, and breakouts
• Study market behavior before and after halving events
• Build data-driven cycle frameworks
This indicator is intended as a research and educational tool and does not provide trading signals or financial advice.

إخلاء المسؤولية
لا يُقصد بالمعلومات والمنشورات أن تكون، أو تشكل، أي نصيحة مالية أو استثمارية أو تجارية أو أنواع أخرى من النصائح أو التوصيات المقدمة أو المعتمدة من TradingView. اقرأ المزيد في شروط الاستخدام.
إخلاء المسؤولية
لا يُقصد بالمعلومات والمنشورات أن تكون، أو تشكل، أي نصيحة مالية أو استثمارية أو تجارية أو أنواع أخرى من النصائح أو التوصيات المقدمة أو المعتمدة من TradingView. اقرأ المزيد في شروط الاستخدام.