HTF Candles - Side Panel
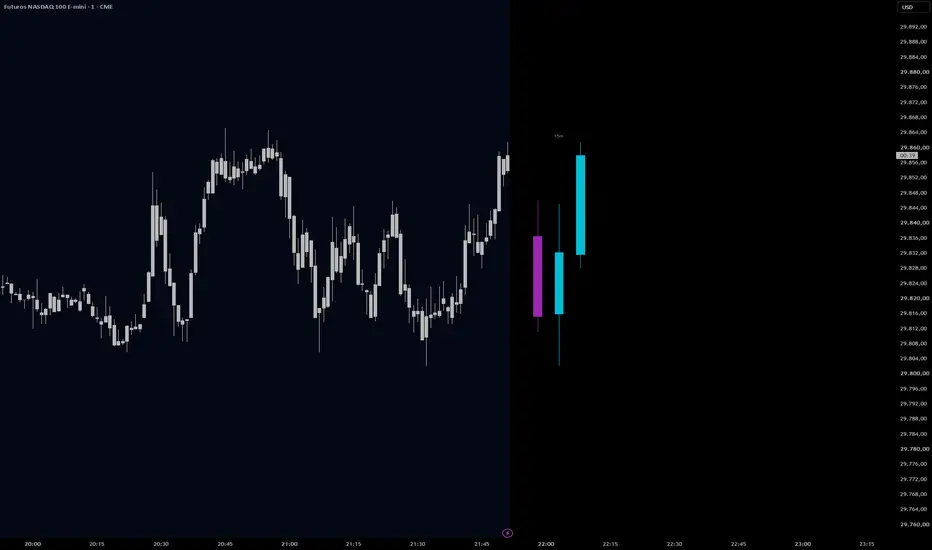
HTF Candles shows the last candles of a higher timeframe as a compact panel to the right of current price. You can follow the higher-timeframe structure without switching charts and without covering the price action with overlaid boxes.
HOW IT WORKS
• Requests the open, high, low and close of the last N bars of the chosen timeframe. The right-most candle is the one still forming and updates in real time.
• Candles are drawn to the right of the last bar, with editable width, spacing and distance, and a small label with the timeframe (e.g. 5m, 15m, 1H).
• Bullish and bearish colors are editable.
• If the selected timeframe is not higher than the chart timeframe, the script shows a message instead of drawing.
HOW TO USE
Keep a lower timeframe for execution and read the higher-timeframe candle in formation next to it. For example, an M5 panel on an M1 chart, or an H1 panel on an M5 chart. Useful things to watch:
• whether the forming candle is sweeping the previous candle's high or low;
• body versus wick: is the candle closing strong or rejecting;
• where the current candle sits relative to the previous ones.
It works well alongside Sigma Map, which draws volatility-based levels from the session open.
LIMITATIONS
• Display only: no signals or alerts.
• The forming candle keeps changing until it closes.
• The panel is drawn on the last bars of the chart, so it is meant for live reading, not for reviewing history.
HOW IT WORKS
• Requests the open, high, low and close of the last N bars of the chosen timeframe. The right-most candle is the one still forming and updates in real time.
• Candles are drawn to the right of the last bar, with editable width, spacing and distance, and a small label with the timeframe (e.g. 5m, 15m, 1H).
• Bullish and bearish colors are editable.
• If the selected timeframe is not higher than the chart timeframe, the script shows a message instead of drawing.
HOW TO USE
Keep a lower timeframe for execution and read the higher-timeframe candle in formation next to it. For example, an M5 panel on an M1 chart, or an H1 panel on an M5 chart. Useful things to watch:
• whether the forming candle is sweeping the previous candle's high or low;
• body versus wick: is the candle closing strong or rejecting;
• where the current candle sits relative to the previous ones.
It works well alongside Sigma Map, which draws volatility-based levels from the session open.
LIMITATIONS
• Display only: no signals or alerts.
• The forming candle keeps changing until it closes.
• The panel is drawn on the last bars of the chart, so it is meant for live reading, not for reviewing history.

إخلاء المسؤولية
لا يُقصد بالمعلومات والمنشورات أن تكون، أو تشكل، أي نصيحة مالية أو استثمارية أو تجارية أو أنواع أخرى من النصائح أو التوصيات المقدمة أو المعتمدة من TradingView. اقرأ المزيد في شروط الاستخدام.
إخلاء المسؤولية
لا يُقصد بالمعلومات والمنشورات أن تكون، أو تشكل، أي نصيحة مالية أو استثمارية أو تجارية أو أنواع أخرى من النصائح أو التوصيات المقدمة أو المعتمدة من TradingView. اقرأ المزيد في شروط الاستخدام.