Seasonality Columns
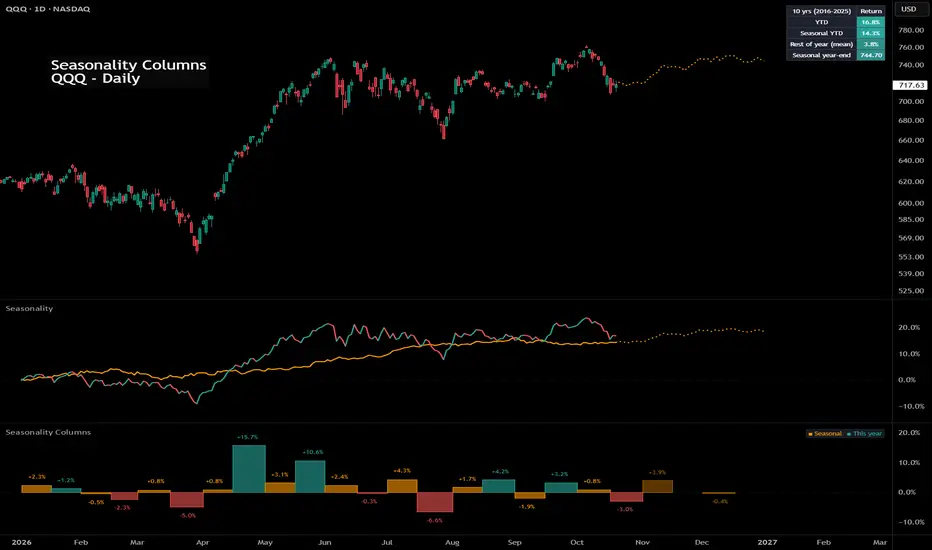
Seasonality Columns shows how a symbol has typically moved in each month, week or quarter of the year, next to how it has moved this year.
It is a companion to the Seasonality indicator and uses the same calculation. It works on its own, or underneath Seasonality for the full picture.
HOW IT WORKS
• Each past calendar year's return is measured from the prior year's final close and placed on a common 365-day calendar by bar date, so stocks, 24/7 crypto, forex and futures line up.
• The last N complete years (default 10) are combined day by day into a seasonal composite, using a compounded mean (default) or the median. Years with a late start, an early end, data gaps or thin data are skipped.
• For each period of the current year, two columns are drawn side by side:
– Orange (left): the composite's change across the period, i.e. what it typically did. With the mean, an October column is exactly the compounded average of past Octobers' returns.
– Green/red (right): this year's actual change over the same period. The current period is still forming.
• Periods still to come this year are drawn as lighter outlined orange boxes, up to Dec 31.
• Each column is labelled with its % change, and a small key sits at the top right.
SETTINGS
• Years to use, Presidential cycle, Average: set these the same as in Seasonality to compare like with like.
• Period: Month (default), Week (Mon–Sun), Quarter, or Each chart bar.
• Seasonal color, Up color / Down color, Show values, Show key.
HOW TO USE
• Use a daily, weekly or monthly chart. A period must be longer than the chart's bars; for example, on a monthly chart Week and Month fall back to one column per bar.
• Look for months that are consistently strong or weak, and compare this year's column with the typical one.
• To see which years were used and how much they disagree, add the Seasonality indicator and hover its panel.
LIMITATIONS
• About 10 years per period is a small sample, and scanning many periods will turn up patterns by chance.
• Turn on dividend adjustment for stocks and back-adjustment for continuous futures. Otherwise ex-dividend drops and contract rolls show up as seasonal moves.
• TradingView loads limited history on daily charts. Weekly and monthly charts reach further back.
• Only standard daily, weekly and monthly charts are supported (no intraday, Heikin Ashi, Renko and similar).
This shows a historical tendency. It is not a forecast or trading advice.
It is a companion to the Seasonality indicator and uses the same calculation. It works on its own, or underneath Seasonality for the full picture.
HOW IT WORKS
• Each past calendar year's return is measured from the prior year's final close and placed on a common 365-day calendar by bar date, so stocks, 24/7 crypto, forex and futures line up.
• The last N complete years (default 10) are combined day by day into a seasonal composite, using a compounded mean (default) or the median. Years with a late start, an early end, data gaps or thin data are skipped.
• For each period of the current year, two columns are drawn side by side:
– Orange (left): the composite's change across the period, i.e. what it typically did. With the mean, an October column is exactly the compounded average of past Octobers' returns.
– Green/red (right): this year's actual change over the same period. The current period is still forming.
• Periods still to come this year are drawn as lighter outlined orange boxes, up to Dec 31.
• Each column is labelled with its % change, and a small key sits at the top right.
SETTINGS
• Years to use, Presidential cycle, Average: set these the same as in Seasonality to compare like with like.
• Period: Month (default), Week (Mon–Sun), Quarter, or Each chart bar.
• Seasonal color, Up color / Down color, Show values, Show key.
HOW TO USE
• Use a daily, weekly or monthly chart. A period must be longer than the chart's bars; for example, on a monthly chart Week and Month fall back to one column per bar.
• Look for months that are consistently strong or weak, and compare this year's column with the typical one.
• To see which years were used and how much they disagree, add the Seasonality indicator and hover its panel.
LIMITATIONS
• About 10 years per period is a small sample, and scanning many periods will turn up patterns by chance.
• Turn on dividend adjustment for stocks and back-adjustment for continuous futures. Otherwise ex-dividend drops and contract rolls show up as seasonal moves.
• TradingView loads limited history on daily charts. Weekly and monthly charts reach further back.
• Only standard daily, weekly and monthly charts are supported (no intraday, Heikin Ashi, Renko and similar).
This shows a historical tendency. It is not a forecast or trading advice.

إخلاء المسؤولية
لا يُقصد بالمعلومات والمنشورات أن تكون، أو تشكل، أي نصيحة مالية أو استثمارية أو تجارية أو أنواع أخرى من النصائح أو التوصيات المقدمة أو المعتمدة من TradingView. اقرأ المزيد في شروط الاستخدام.
إخلاء المسؤولية
لا يُقصد بالمعلومات والمنشورات أن تكون، أو تشكل، أي نصيحة مالية أو استثمارية أو تجارية أو أنواع أخرى من النصائح أو التوصيات المقدمة أو المعتمدة من TradingView. اقرأ المزيد في شروط الاستخدام.