Volatility Reactor [MontyCodex]
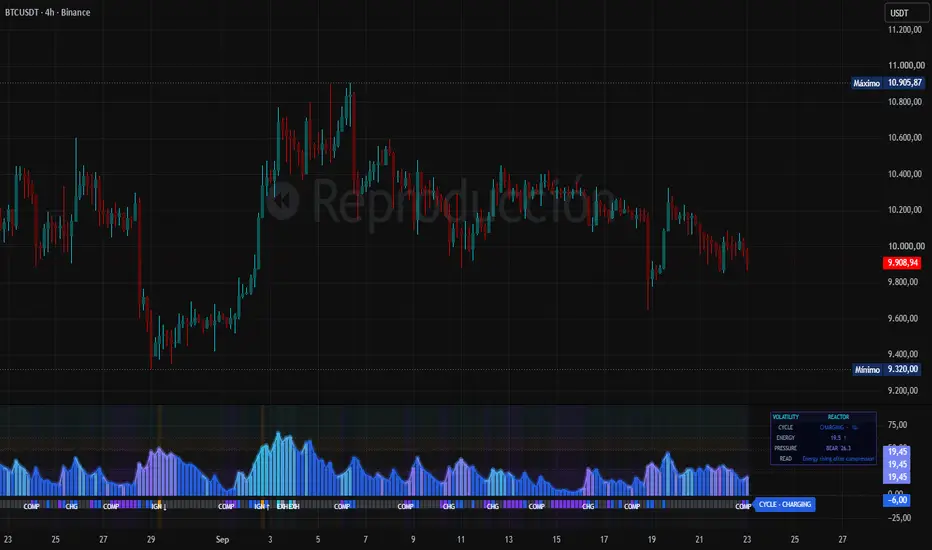
Volatility Reactor [MontyCodexPro]
Description
Volatility Reactor [MontyCodexPro] is a volatility-regime oscillator designed to answer a question that traditional volatility indicators often leave unresolved:
What stage of the volatility cycle is the market currently in?
Instead of displaying only ATR, Bollinger Band width, or a simple compression signal, Volatility Reactor combines several measurements into a structured volatility model.
The indicator separates two concepts that should not be confused:
Reactor Energy
Measures the intensity of the current volatility regime.
Directional Pressure
Measures whether price pressure is predominantly bullish, bearish, or balanced.
These two dimensions are then combined with a dedicated Volatility Cycle engine that classifies market conditions into:
COMPRESSION → CHARGING → IGNITION → EXPANSION → EXHAUSTION
The objective is not to generate automatic BUY or SELL signals.
The objective is to make changes in volatility easier to identify, interpret, and monitor.
⚡ REACTOR ENERGY
The main histogram represents Reactor Energy, normalized on a scale from approximately 0 to 100.
Its height answers:
How much volatility energy is currently present in the market?
Lower readings generally indicate contraction.
Higher readings indicate increasing or established volatility expansion.
Reactor Energy is built from several independent components:
- normalized ATR;
- Bollinger Band width;
- True Range expansion;
- relative volume;
- price efficiency.
These measurements are normalized against the recent market regime before being combined.
This means that the oscillator is not simply measuring whether ATR is high or low in absolute terms.
It attempts to determine whether current market activity is elevated or compressed relative to its own recent behavior.
🎨 DIRECTIONAL PRESSURE
The color of the histogram represents Directional Pressure.
This is calculated independently from Reactor Energy.
Directional Pressure evaluates information such as:
- candle body pressure;
- closing location within the candle;
- normalized momentum;
- directional price efficiency.
The result ranges approximately from:
-100 → bearish pressure
0 → balanced pressure
+100 → bullish pressure
By default:
Cyan / turquoise represents bullish pressure.
Blue represents balanced or weak directional pressure.
Purple represents bearish pressure.
This separation is important.
A market can have:
- high volatility with bullish pressure;
- high volatility with bearish pressure;
- high volatility without strong directional pressure;
- low volatility while directional pressure begins to develop.
Volatility and direction are therefore treated as two different variables.
🔄 VOLATILITY CYCLE
The lower ribbon represents the current Volatility Cycle.
Unlike the histogram, the ribbon does not measure magnitude.
It answers:
What phase of the volatility process is currently active?
The cycle contains five main states.
🟣 COMPRESSION
Compression represents a market where volatility has contracted.
The engine looks for conditions such as:
- reduced Reactor Energy;
- ATR below its recent regime;
- contracted Bollinger Band width;
- reduced range expansion.
Compression does not predict the direction of the next movement.
It simply identifies an environment where volatility has contracted.
Think of it as:
Energy is low and the market is compressed.
🔵 CHARGING
Charging appears when Energy begins to increase after a qualified compression.
The market has not yet reached a confirmed expansion regime, but volatility is starting to build.
It answers:
Is the market beginning to wake up after compression?
Charging should be interpreted as a transition phase rather than a directional signal.
🟠 IGNITION
Ignition represents the initial release of volatility after recent compression.
It occurs when Reactor Energy accelerates through the Ignition threshold while range or Bollinger expansion begins to appear.
In simple terms:
IGNITION = volatility release is starting.
Ignition is different from Expansion.
Ignition identifies the beginning of the release.
Expansion identifies a volatility regime that has already become more established.
Directional Pressure helps interpret the event:
IGNITION ↑
Volatility is being released with predominantly bullish pressure.
IGNITION ↓
Volatility is being released with predominantly bearish pressure.
A directional arrow does not represent a trade recommendation.
It describes the pressure accompanying the volatility release.
🔷 EXPANSION
Expansion represents an established high-energy volatility environment.
The engine considers factors including:
- elevated Reactor Energy;
- directional pressure;
- price efficiency;
- persistence of the expansion.
This state answers:
Has volatility moved beyond the initial release and developed into a sustained expansion?
Expansion can occur with either bullish or bearish directional pressure.
Again:
Expansion is a market condition, not an entry signal.
⚪ EXHAUSTION
Exhaustion appears when a previously elevated Energy regime begins to lose strength.
The engine evaluates the decline of Reactor Energy after a recent expansion.
It answers:
Is the current volatility expansion beginning to lose energy?
Exhaustion does not automatically mean that price will reverse.
A market can lose volatility while continuing in the same direction.
The state should therefore be interpreted as:
The expansion is losing energy.
Not:
The market must reverse.
📊 HOW TO READ THE INDICATOR
Volatility Reactor is designed around three visual layers.
Histogram height
Represents:
REACTOR ENERGY
Higher histogram = stronger volatility regime.
Lower histogram = contracted volatility regime.
Histogram color
Represents:
DIRECTIONAL PRESSURE
Cyan = bullish pressure.
Purple = bearish pressure.
Blue = balanced or weak directional pressure.
Lower ribbon
Represents:
VOLATILITY CYCLE
The ribbon identifies whether the market is currently in:
- Compression;
- Charging;
- Ignition;
- Expansion;
- Exhaustion;
- or Neutral conditions.
The compact labels below the ribbon highlight important changes in the cycle while keeping the oscillator visually clean.
📡 REACTOR RADAR
Volatility Reactor includes a compact information panel for users who want an immediate interpretation of the current environment.
The Radar displays:
CYCLE
The current volatility-cycle phase and how many bars the market has remained in that state.
ENERGY
The current Reactor Energy reading and whether Energy is increasing, decreasing, or remaining relatively stable.
PRESSURE
The current directional pressure and its strength.
READ
A simplified interpretation of the current environment.
Examples may include:
Energy contracted · waiting for release
Energy rising after compression
Volatility release starting · bullish
Volatility expanding · bearish
Expansion losing energy
These messages are descriptive interpretations of the indicator's internal measurements.
They are not predictions or trading instructions.
🖱️ INTERACTIVE INFORMATION
Several fields inside the Reactor Radar include TradingView tooltips.
Move the mouse cursor over the corresponding information to access additional explanations about:
- the Volatility Cycle;
- Reactor Energy;
- Directional Pressure;
- the current interpretation.
No click is required.
TradingView automatically displays the additional information when the cursor remains over the corresponding field.
🎛️ REACTOR PROFILES
Volatility Reactor includes four operating profiles.
Responsive
Uses shorter calculation periods and reduced smoothing.
Designed for traders who want the Reactor to respond more quickly to changes in market conditions.
It may also generate more state transitions.
Balanced
The default profile.
Designed to provide a compromise between responsiveness and stability.
This is the recommended starting point for most users.
Smooth
Uses longer calculation periods and additional smoothing.
Designed for users who prefer a more structural view of volatility with fewer short-term changes.
Custom
Allows experienced users to configure the Reactor engine manually.
Advanced parameters include:
- regime length;
- Energy smoothing;
- ATR period;
- Bollinger period;
- range baseline;
- volume baseline;
- price efficiency;
- momentum;
- directional pressure smoothing.
⚙️ ADVANCED STATE MODEL
The Custom configuration also provides access to the internal volatility-cycle thresholds.
Users can adjust:
- Compression threshold;
- Ignition threshold;
- Expansion threshold;
- minimum directional pressure;
- compression memory;
- minimum compression duration;
- Exhaustion sensitivity;
- minimum price efficiency.
These controls make it possible to adapt the Reactor to different markets, timeframes, and trading styles.
🚨 ALERTS
Volatility Reactor includes configurable TradingView alerts for:
- Compression;
- Charging;
- Ignition;
- Expansion;
- Exhaustion;
- Directional Pressure Flip;
- Any Reactor Event.
Important events such as Ignition, Expansion, and Exhaustion are enabled by default in the alert configuration.
Users can also require alerts to be confirmed at candle close.
✅ CLOSE CONFIRMATION
When Close confirm is enabled, alert events are only exposed after the current candle has been confirmed.
This can help reduce intrabar state changes when monitoring the indicator with TradingView alerts.
🎨 CUSTOMIZATION
The visual appearance can be customized extensively.
Users can modify:
- bullish pressure color;
- bearish pressure color;
- balanced pressure color;
- Compression color;
- Charging color;
- Ignition color;
- Expansion color;
- Exhaustion color;
- histogram transparency;
- glow intensity;
- Volatility Cycle visibility;
- cycle labels;
- background highlighting;
- Reactor Radar;
- optional candle coloring.
The default visual design follows the MontyCodexPro color system.
🚀 WHAT MAKES VOLATILITY REACTOR DIFFERENT?
Traditional volatility indicators often answer only one question:
Is volatility high or low?
Volatility Reactor attempts to answer several related questions:
Is volatility compressed?
Is Energy beginning to build?
Has the market started releasing volatility?
Has that release developed into sustained Expansion?
Is the Expansion beginning to lose Energy?
Is the pressure behind the movement bullish or bearish?
The main idea is therefore not to add another volatility measurement.
It is to organize multiple volatility measurements into a readable market process.
Instead of viewing volatility as a single value, Volatility Reactor represents it as a cycle.
💡 PRACTICAL USE
Volatility Reactor can be used to complement:
- market structure analysis;
- breakout analysis;
- trend-following systems;
- momentum indicators;
- support and resistance;
- discretionary price-action analysis.
For example, a trader may use the Reactor to distinguish between:
a breakout occurring during low Energy
and
a breakout accompanied by Ignition and increasing directional pressure.
Similarly, the Exhaustion state can help identify when an existing high-volatility environment is beginning to lose intensity.
The Reactor provides context.
The trading decision remains with the user.
🎯 WHO IS IT DESIGNED FOR?
Volatility Reactor can be applied to different markets and timeframes, including:
- cryptocurrencies;
- Forex;
- indices;
- stocks;
- commodities;
- gold.
Its normalized design allows the engine to adapt its measurements to the recent behavior of the selected market rather than relying only on absolute volatility values.
⚠️ CORRECT USE OF THE INDICATOR
Volatility Reactor is not an automatic trading system.
Compression does not guarantee a breakout.
Ignition does not guarantee continuation.
Expansion does not guarantee that a trend will continue.
Exhaustion does not guarantee a reversal.
Directional Pressure does not represent future price probability.
The indicator should be used as a contextual volatility tool together with appropriate market analysis and risk management.
⚠️ DISCLAIMER
Volatility Reactor [MontyCodexPro] is a technical analysis tool intended exclusively for educational and informational purposes.
It does not constitute financial advice, investment advice, or a recommendation to buy or sell any financial instrument.
The indicator does not predict future market movements and does not guarantee results.
Financial markets involve risk. Every user is responsible for their own trading decisions, testing methodology, and risk management.
Description
Volatility Reactor [MontyCodexPro] is a volatility-regime oscillator designed to answer a question that traditional volatility indicators often leave unresolved:
What stage of the volatility cycle is the market currently in?
Instead of displaying only ATR, Bollinger Band width, or a simple compression signal, Volatility Reactor combines several measurements into a structured volatility model.
The indicator separates two concepts that should not be confused:
Reactor Energy
Measures the intensity of the current volatility regime.
Directional Pressure
Measures whether price pressure is predominantly bullish, bearish, or balanced.
These two dimensions are then combined with a dedicated Volatility Cycle engine that classifies market conditions into:
COMPRESSION → CHARGING → IGNITION → EXPANSION → EXHAUSTION
The objective is not to generate automatic BUY or SELL signals.
The objective is to make changes in volatility easier to identify, interpret, and monitor.
⚡ REACTOR ENERGY
The main histogram represents Reactor Energy, normalized on a scale from approximately 0 to 100.
Its height answers:
How much volatility energy is currently present in the market?
Lower readings generally indicate contraction.
Higher readings indicate increasing or established volatility expansion.
Reactor Energy is built from several independent components:
- normalized ATR;
- Bollinger Band width;
- True Range expansion;
- relative volume;
- price efficiency.
These measurements are normalized against the recent market regime before being combined.
This means that the oscillator is not simply measuring whether ATR is high or low in absolute terms.
It attempts to determine whether current market activity is elevated or compressed relative to its own recent behavior.
🎨 DIRECTIONAL PRESSURE
The color of the histogram represents Directional Pressure.
This is calculated independently from Reactor Energy.
Directional Pressure evaluates information such as:
- candle body pressure;
- closing location within the candle;
- normalized momentum;
- directional price efficiency.
The result ranges approximately from:
-100 → bearish pressure
0 → balanced pressure
+100 → bullish pressure
By default:
Cyan / turquoise represents bullish pressure.
Blue represents balanced or weak directional pressure.
Purple represents bearish pressure.
This separation is important.
A market can have:
- high volatility with bullish pressure;
- high volatility with bearish pressure;
- high volatility without strong directional pressure;
- low volatility while directional pressure begins to develop.
Volatility and direction are therefore treated as two different variables.
🔄 VOLATILITY CYCLE
The lower ribbon represents the current Volatility Cycle.
Unlike the histogram, the ribbon does not measure magnitude.
It answers:
What phase of the volatility process is currently active?
The cycle contains five main states.
🟣 COMPRESSION
Compression represents a market where volatility has contracted.
The engine looks for conditions such as:
- reduced Reactor Energy;
- ATR below its recent regime;
- contracted Bollinger Band width;
- reduced range expansion.
Compression does not predict the direction of the next movement.
It simply identifies an environment where volatility has contracted.
Think of it as:
Energy is low and the market is compressed.
🔵 CHARGING
Charging appears when Energy begins to increase after a qualified compression.
The market has not yet reached a confirmed expansion regime, but volatility is starting to build.
It answers:
Is the market beginning to wake up after compression?
Charging should be interpreted as a transition phase rather than a directional signal.
🟠 IGNITION
Ignition represents the initial release of volatility after recent compression.
It occurs when Reactor Energy accelerates through the Ignition threshold while range or Bollinger expansion begins to appear.
In simple terms:
IGNITION = volatility release is starting.
Ignition is different from Expansion.
Ignition identifies the beginning of the release.
Expansion identifies a volatility regime that has already become more established.
Directional Pressure helps interpret the event:
IGNITION ↑
Volatility is being released with predominantly bullish pressure.
IGNITION ↓
Volatility is being released with predominantly bearish pressure.
A directional arrow does not represent a trade recommendation.
It describes the pressure accompanying the volatility release.
🔷 EXPANSION
Expansion represents an established high-energy volatility environment.
The engine considers factors including:
- elevated Reactor Energy;
- directional pressure;
- price efficiency;
- persistence of the expansion.
This state answers:
Has volatility moved beyond the initial release and developed into a sustained expansion?
Expansion can occur with either bullish or bearish directional pressure.
Again:
Expansion is a market condition, not an entry signal.
⚪ EXHAUSTION
Exhaustion appears when a previously elevated Energy regime begins to lose strength.
The engine evaluates the decline of Reactor Energy after a recent expansion.
It answers:
Is the current volatility expansion beginning to lose energy?
Exhaustion does not automatically mean that price will reverse.
A market can lose volatility while continuing in the same direction.
The state should therefore be interpreted as:
The expansion is losing energy.
Not:
The market must reverse.
📊 HOW TO READ THE INDICATOR
Volatility Reactor is designed around three visual layers.
Histogram height
Represents:
REACTOR ENERGY
Higher histogram = stronger volatility regime.
Lower histogram = contracted volatility regime.
Histogram color
Represents:
DIRECTIONAL PRESSURE
Cyan = bullish pressure.
Purple = bearish pressure.
Blue = balanced or weak directional pressure.
Lower ribbon
Represents:
VOLATILITY CYCLE
The ribbon identifies whether the market is currently in:
- Compression;
- Charging;
- Ignition;
- Expansion;
- Exhaustion;
- or Neutral conditions.
The compact labels below the ribbon highlight important changes in the cycle while keeping the oscillator visually clean.
📡 REACTOR RADAR
Volatility Reactor includes a compact information panel for users who want an immediate interpretation of the current environment.
The Radar displays:
CYCLE
The current volatility-cycle phase and how many bars the market has remained in that state.
ENERGY
The current Reactor Energy reading and whether Energy is increasing, decreasing, or remaining relatively stable.
PRESSURE
The current directional pressure and its strength.
READ
A simplified interpretation of the current environment.
Examples may include:
Energy contracted · waiting for release
Energy rising after compression
Volatility release starting · bullish
Volatility expanding · bearish
Expansion losing energy
These messages are descriptive interpretations of the indicator's internal measurements.
They are not predictions or trading instructions.
🖱️ INTERACTIVE INFORMATION
Several fields inside the Reactor Radar include TradingView tooltips.
Move the mouse cursor over the corresponding information to access additional explanations about:
- the Volatility Cycle;
- Reactor Energy;
- Directional Pressure;
- the current interpretation.
No click is required.
TradingView automatically displays the additional information when the cursor remains over the corresponding field.
🎛️ REACTOR PROFILES
Volatility Reactor includes four operating profiles.
Responsive
Uses shorter calculation periods and reduced smoothing.
Designed for traders who want the Reactor to respond more quickly to changes in market conditions.
It may also generate more state transitions.
Balanced
The default profile.
Designed to provide a compromise between responsiveness and stability.
This is the recommended starting point for most users.
Smooth
Uses longer calculation periods and additional smoothing.
Designed for users who prefer a more structural view of volatility with fewer short-term changes.
Custom
Allows experienced users to configure the Reactor engine manually.
Advanced parameters include:
- regime length;
- Energy smoothing;
- ATR period;
- Bollinger period;
- range baseline;
- volume baseline;
- price efficiency;
- momentum;
- directional pressure smoothing.
⚙️ ADVANCED STATE MODEL
The Custom configuration also provides access to the internal volatility-cycle thresholds.
Users can adjust:
- Compression threshold;
- Ignition threshold;
- Expansion threshold;
- minimum directional pressure;
- compression memory;
- minimum compression duration;
- Exhaustion sensitivity;
- minimum price efficiency.
These controls make it possible to adapt the Reactor to different markets, timeframes, and trading styles.
🚨 ALERTS
Volatility Reactor includes configurable TradingView alerts for:
- Compression;
- Charging;
- Ignition;
- Expansion;
- Exhaustion;
- Directional Pressure Flip;
- Any Reactor Event.
Important events such as Ignition, Expansion, and Exhaustion are enabled by default in the alert configuration.
Users can also require alerts to be confirmed at candle close.
✅ CLOSE CONFIRMATION
When Close confirm is enabled, alert events are only exposed after the current candle has been confirmed.
This can help reduce intrabar state changes when monitoring the indicator with TradingView alerts.
🎨 CUSTOMIZATION
The visual appearance can be customized extensively.
Users can modify:
- bullish pressure color;
- bearish pressure color;
- balanced pressure color;
- Compression color;
- Charging color;
- Ignition color;
- Expansion color;
- Exhaustion color;
- histogram transparency;
- glow intensity;
- Volatility Cycle visibility;
- cycle labels;
- background highlighting;
- Reactor Radar;
- optional candle coloring.
The default visual design follows the MontyCodexPro color system.
🚀 WHAT MAKES VOLATILITY REACTOR DIFFERENT?
Traditional volatility indicators often answer only one question:
Is volatility high or low?
Volatility Reactor attempts to answer several related questions:
Is volatility compressed?
Is Energy beginning to build?
Has the market started releasing volatility?
Has that release developed into sustained Expansion?
Is the Expansion beginning to lose Energy?
Is the pressure behind the movement bullish or bearish?
The main idea is therefore not to add another volatility measurement.
It is to organize multiple volatility measurements into a readable market process.
Instead of viewing volatility as a single value, Volatility Reactor represents it as a cycle.
💡 PRACTICAL USE
Volatility Reactor can be used to complement:
- market structure analysis;
- breakout analysis;
- trend-following systems;
- momentum indicators;
- support and resistance;
- discretionary price-action analysis.
For example, a trader may use the Reactor to distinguish between:
a breakout occurring during low Energy
and
a breakout accompanied by Ignition and increasing directional pressure.
Similarly, the Exhaustion state can help identify when an existing high-volatility environment is beginning to lose intensity.
The Reactor provides context.
The trading decision remains with the user.
🎯 WHO IS IT DESIGNED FOR?
Volatility Reactor can be applied to different markets and timeframes, including:
- cryptocurrencies;
- Forex;
- indices;
- stocks;
- commodities;
- gold.
Its normalized design allows the engine to adapt its measurements to the recent behavior of the selected market rather than relying only on absolute volatility values.
⚠️ CORRECT USE OF THE INDICATOR
Volatility Reactor is not an automatic trading system.
Compression does not guarantee a breakout.
Ignition does not guarantee continuation.
Expansion does not guarantee that a trend will continue.
Exhaustion does not guarantee a reversal.
Directional Pressure does not represent future price probability.
The indicator should be used as a contextual volatility tool together with appropriate market analysis and risk management.
⚠️ DISCLAIMER
Volatility Reactor [MontyCodexPro] is a technical analysis tool intended exclusively for educational and informational purposes.
It does not constitute financial advice, investment advice, or a recommendation to buy or sell any financial instrument.
The indicator does not predict future market movements and does not guarantee results.
Financial markets involve risk. Every user is responsible for their own trading decisions, testing methodology, and risk management.

No te pierdas ningún contenido exclusivo, entra en MontyCodexPro.com
إخلاء المسؤولية
لا يُقصد بالمعلومات والمنشورات أن تكون، أو تشكل، أي نصيحة مالية أو استثمارية أو تجارية أو أنواع أخرى من النصائح أو التوصيات المقدمة أو المعتمدة من TradingView. اقرأ المزيد في شروط الاستخدام.
No te pierdas ningún contenido exclusivo, entra en MontyCodexPro.com
إخلاء المسؤولية
لا يُقصد بالمعلومات والمنشورات أن تكون، أو تشكل، أي نصيحة مالية أو استثمارية أو تجارية أو أنواع أخرى من النصائح أو التوصيات المقدمة أو المعتمدة من TradingView. اقرأ المزيد في شروط الاستخدام.