[AmendLogic] Bitcoin/BTC ML Regime Model
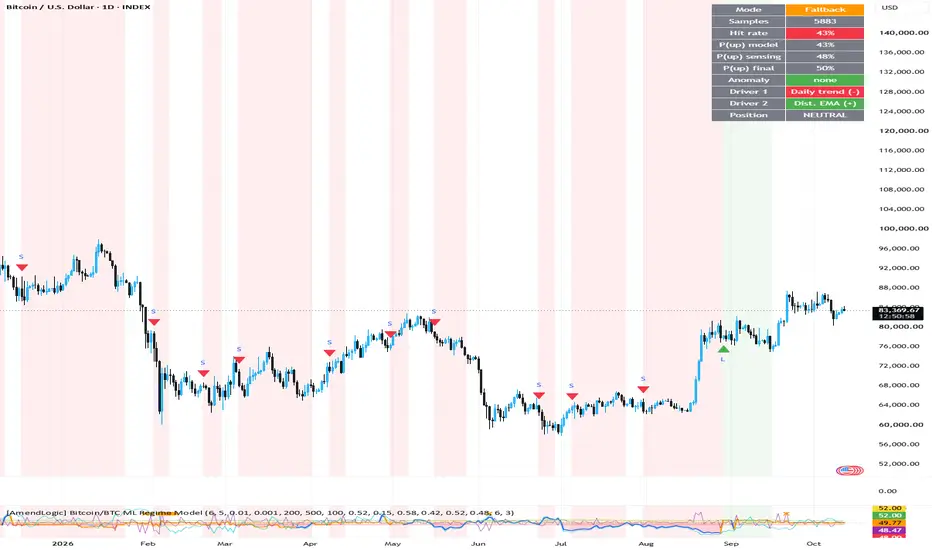
The Bitcoin/BTC ML Regime Model is a machine learning inspired regime detection indicator designed to estimate the probability of future bullish or bearish market conditions.
Unlike traditional indicators that rely on a single technical signal, this model combines multiple market features, macroeconomic inputs, and adaptive learning techniques to evaluate the current Bitcoin market environment.
How it works
The model continuously learns from historical price behavior using a walk-forward logistic regression approach. It evaluates a set of normalized features including:
These factors are combined into a probability score representing the estimated likelihood of upward price movement over a user-defined prediction horizon.
Reliability Management
Machine learning models may underperform during changing market conditions. To address this, the indicator includes:
This approach helps distinguish between periods where the model is performing acceptably and periods where additional caution may be warranted.
Optional Demand Sensing Layer
An optional demand sensing component can be enabled to increase responsiveness to short-term momentum and volume shifts.
This layer acts as a supplementary heuristic filter and can be blended with the main model output through a configurable weighting system.
Risk Filters
The indicator includes several safeguards designed to reduce noise:
Visual Features
The script provides:
Information Display
The dashboard shows:
Interpretation
Important
This indicator is designed for educational and analytical purposes only.
It does not predict future prices with certainty and should not be considered financial advice. All trading involves risk, and past performance of any model does not guarantee future results.
Unlike traditional indicators that rely on a single technical signal, this model combines multiple market features, macroeconomic inputs, and adaptive learning techniques to evaluate the current Bitcoin market environment.
How it works
The model continuously learns from historical price behavior using a walk-forward logistic regression approach. It evaluates a set of normalized features including:
- Short, medium, and long-term momentum
- RSI
- Distance from trend averages
- Volume behavior
- Volatility conditions
- U.S. Dollar Index (DXY)
- Treasury Inflation-Protected Securities (TIP)
- Higher timeframe trend structure
These factors are combined into a probability score representing the estimated likelihood of upward price movement over a user-defined prediction horizon.
Reliability Management
Machine learning models may underperform during changing market conditions. To address this, the indicator includes:
- Minimum training sample requirements
- Rolling hit-rate evaluation
- Automatic confidence validation
- Fallback regime logic when model reliability drops below a user-defined threshold
This approach helps distinguish between periods where the model is performing acceptably and periods where additional caution may be warranted.
Optional Demand Sensing Layer
An optional demand sensing component can be enabled to increase responsiveness to short-term momentum and volume shifts.
This layer acts as a supplementary heuristic filter and can be blended with the main model output through a configurable weighting system.
Risk Filters
The indicator includes several safeguards designed to reduce noise:
- Anomaly detection based on abnormal price, volume, or volatility behavior
- Trend alignment filter using a higher-timeframe EMA
- Entry and exit hysteresis thresholds
- Minimum holding period logic
Visual Features
The script provides:
- Dynamic probability visualization
- Long, short, and neutral regime detection
- Price chart regime background coloring
- Long and short entry markers
- Model reliability monitoring
- Feature contribution analysis
- Real-time status dashboard
Information Display
The dashboard shows:
- Current operating mode (ML or fallback)
- Training sample count
- Historical hit rate
- Upside probability estimates
- Active anomaly status
- Dominant market drivers
- Current regime state
Interpretation
- Higher probability values indicate stronger bullish conditions according to the model.
- Lower probability values indicate stronger bearish conditions.
- Values near 50% indicate uncertainty or balanced market conditions.
- Long and short signals are generated only when probability thresholds and risk filters align.
Important
This indicator is designed for educational and analytical purposes only.
It does not predict future prices with certainty and should not be considered financial advice. All trading involves risk, and past performance of any model does not guarantee future results.

Systematic Trading. Clearly defined.
⚙️ Founder of AmendLogic | Pine Script Developer.
Upgrade your edge with our custom indicators & automated strategies.
Join the community: whop.com/amendlogic
⚙️ Founder of AmendLogic | Pine Script Developer.
Upgrade your edge with our custom indicators & automated strategies.
Join the community: whop.com/amendlogic
إخلاء المسؤولية
لا يُقصد بالمعلومات والمنشورات أن تكون، أو تشكل، أي نصيحة مالية أو استثمارية أو تجارية أو أنواع أخرى من النصائح أو التوصيات المقدمة أو المعتمدة من TradingView. اقرأ المزيد في شروط الاستخدام.
Systematic Trading. Clearly defined.
⚙️ Founder of AmendLogic | Pine Script Developer.
Upgrade your edge with our custom indicators & automated strategies.
Join the community: whop.com/amendlogic
⚙️ Founder of AmendLogic | Pine Script Developer.
Upgrade your edge with our custom indicators & automated strategies.
Join the community: whop.com/amendlogic
إخلاء المسؤولية
لا يُقصد بالمعلومات والمنشورات أن تكون، أو تشكل، أي نصيحة مالية أو استثمارية أو تجارية أو أنواع أخرى من النصائح أو التوصيات المقدمة أو المعتمدة من TradingView. اقرأ المزيد في شروط الاستخدام.