Delta Flow Profile 3D [NeBlok]
DELTA FLOW PROFILE 3D [NeBlok]
OVERVIEW
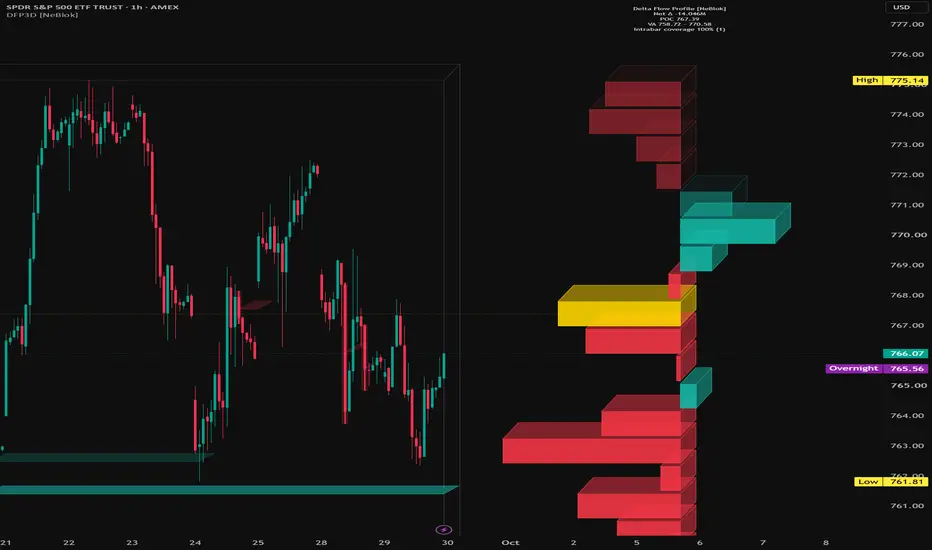
Delta Flow Profile 3D shows where buyers and sellers were aggressive inside a lookback window, and at which prices. It combines four tools in one overlay:
1. A 3D delta profile that shows net buying or selling at each price level
2. A Point of Control (POC) and Value Area built from total volume
3. Delta spike detection that flags bars with unusually strong buying or selling
4. Imbalance levels anchored to each spike, drawn as 3D plates that stay on the chart until price returns to them
The goal is to show not just where volume traded, but who was in control at each price.
HOW THE DELTA IS CALCULATED
Delta is the difference between buying volume and selling volume. This script estimates it in one of two ways, selected under Delta Method:
- Intrabar (default and recommended): The script requests lower-timeframe bars inside each chart bar. Each intrabar is classified as buying if it closed above its open, or selling if it closed below its open. When an intrabar opens and closes at the same price, the script compares its close to the previous intrabar's close (the tick rule). Adding these up gives a more detailed buy/sell estimate than the chart bar alone can provide.
- Bar Geometry: Each bar's volume is split by where it closed within its high-low range. A close near the high counts mostly as buying, and a close near the low counts mostly as selling. This works on any symbol and timeframe but is less precise.
If Intrabar mode is selected but lower-timeframe data is not available for a bar, that bar automatically falls back to Bar Geometry. The summary label shows the "Intrabar coverage" percentage so you always know how much of the profile is built from intrabar data. Higher is better.
Automatic intrabar timeframe selection (when the Intrabar Timeframe input is left blank):
- Chart at 1 minute or lower: the chart's own timeframe
- Chart up to 1 hour: 1 minute
- Chart up to 4 hours: 5 minutes
- Chart up to 1 day: 15 minutes
- Higher timeframes: 60 minutes
Important: This is an ESTIMATE of order flow built from price and volume data. It is not true bid/ask footprint data from the exchange.
READING THE 3D PROFILE
The profile sits to the right of current price and is split by a vertical dotted axis.
- Bars extending RIGHT of the axis (buy color) = net buying at that price level
- Bars extending LEFT of the axis (sell color) = net selling at that price level
- Bar length = the size of the net delta at that price compared with the largest row in the profile
- Yellow row = POC, the price level with the most total volume (buying plus selling) in the window
- Brighter rows = inside the Value Area (70% of total volume by default)
- Dimmed rows = outside the Value Area
A dotted POC line extends from the start of the lookback window to the profile, so you can see how price has interacted with it over time.
A 3D frame outlines the lookback window, so you can see exactly which bars the profile is measuring.
How traders commonly read it:
- Strong buying below current price can show where buyers defended.
- Strong selling above current price can show where sellers were active.
- The POC is often treated as a "fair value" area that price tends to revisit.
- The Value Area edges mark where most business was done. Moves outside the Value Area are often watched for acceptance (price holds there) or rejection (price returns inside).
- A price level with high total volume but near-zero delta means buyers and sellers were evenly matched there.
DELTA SPIKES (GLOW PILLARS)
A delta spike is a bar whose delta is a statistical outlier compared with recent bars. The script measures this with a z-score over the Spike Baseline Length (default 100 bars).
- Buy-colored pillar = unusually strong buying on that bar
- Sell-colored pillar = unusually strong selling on that bar
Because the threshold is based on standard deviations rather than a fixed volume number, it adapts to each symbol's normal activity. A spike on a thinly traded stock and a spike on a heavily traded index future are both measured against their own recent behavior.
Pillars are only drawn inside the lookback window.
IMBALANCE LEVELS (3D PLATES)
Every delta spike creates an imbalance level. The level is placed at the spike bar's intrabar VWAP (volume-weighted average price), which estimates where the aggressive volume actually traded. With Bar Geometry, it uses the bar's typical price instead.
- Buy-colored plates come from bullish spikes. They are watched as potential support.
- Sell-colored plates come from bearish spikes. They are watched as potential resistance.
- An active level extends to the right on every new bar until price comes back to it.
- Once price returns (mitigation), the level stops extending. If "Keep Mitigated Levels" is on, it stays on the chart in a faded color for reference.
Mitigation Trigger:
- Wick: The level is mitigated as soon as price trades through it (low below a bullish level, or high above a bearish level). This is more sensitive.
- Close: The level is mitigated only when a bar closes through it. This is more forgiving.
How traders commonly use these levels:
- As areas to watch for a reaction when price returns
- As confluence when a level lines up with the POC, a Value Area edge, or a large profile row
- As a record of where strong participants stepped in
An unmitigated level is not a guaranteed reaction point. Treat it as an area of interest, not a signal on its own.
SETTINGS GUIDE
Delta Engine
- Delta Method: Intrabar (more accurate) or Bar Geometry (works everywhere)
- Intrabar Timeframe: Leave blank for automatic, or set your own. If you choose a timeframe higher than the chart's, the script uses the chart timeframe instead.
Profile
- Lookback Bars (default 300): How many bars the profile, frame, and spike pillars cover
- Rows (default 28): Number of price levels. More rows give finer detail, fewer rows give a smoother picture.
- Max Bar Length (default 45): Length in bars of the largest row
- Offset From Last Bar (default 15): Gap between the current bar and the profile
- Value Area % (default 70): Share of total volume included in the Value Area
- Highlight POC + POC Line: Turns the yellow POC row and the POC line on or off
- Dim Rows Outside Value Area: Fades rows outside the Value Area
- Show Row Delta Values: Prints the net delta number beside each row
- Show Summary Label: Shows net delta, POC, Value Area range, and intrabar coverage
3D Style
- Depth X: Horizontal depth of the 3D effect, in bars
- Depth Y: Vertical depth of the 3D effect, as a multiple of row height
- Show 3D Window Frame: Turns the lookback frame on or off
Set both depth values to 0 for a flat 2D look.
Delta Spikes & Levels
- Show Delta Spike Pillars: Turns the pillars on or off
- Spike Baseline Length (default 100): Number of bars used to define "normal" delta
- Spike Threshold (default 2.5): Z-score required to count as a spike. Raise it for fewer, stronger spikes. Lower it for more frequent signals.
- Show Imbalance Levels: Turns the plates on or off
- Max Levels (default 20): Maximum number of levels kept on the chart
- Mitigation Trigger: Wick or Close
- Keep Mitigated Levels: Keeps or removes levels after price returns to them
Colors
- Buy Delta, Sell Delta, POC, and Frame/Axis colors are all adjustable.
Data Window
- "Bar Delta" and "Delta Z-Score" for each bar appear in the Data Window. You can use them to check how strong any individual bar was.
ALERTS
The script includes four alerts, each evaluated once per bar close:
- Bullish delta spike (includes the delta value and level price)
- Bearish delta spike (includes the delta value and level price)
- Price returned to a bullish imbalance level
- Price returned to a bearish imbalance level
To set them up: open the Alerts panel, choose this indicator as the condition, and select "Any alert() function call."
TIPS FOR BEST RESULTS
- Use symbols with reliable volume data: stocks, ETFs, futures, and crypto. The script stops with an error if the symbol has no volume data.
- Watch the Intrabar coverage percentage. TradingView limits how much lower-timeframe history is available, so older bars in a long lookback may fall back to Bar Geometry. Shorter lookbacks or a higher intrabar timeframe usually improve coverage.
- The profile spreads each bar's buy and sell volume evenly across that bar's high-low range. Using more bars in the lookback and a moderate row count gives a more stable picture.
- Spikes and levels on the live, unfinished bar can appear and disappear as the bar develops. They are final only once the bar closes.
- The profile, POC, Value Area, and frame are redrawn on every new bar as the lookback window moves forward.
- This tool works best as context alongside your own analysis, market structure, and risk management, not as a standalone entry signal.
DISCLAIMER
This indicator is provided free for educational and informational purposes only. It is not financial advice, investment advice, trading advice, or a recommendation to buy or sell any security, futures contract, or other financial instrument.
Order flow and delta values in this script are estimates built from price and volume data and may not reflect actual exchange-level buy and sell activity. Signals, levels, and alerts can be wrong, can change on the live bar, and may behave differently on different symbols, timeframes, and data feeds.
Trading involves substantial risk of loss and is not suitable for everyone. Past performance, whether actual or shown by any indicator, does not guarantee future results. You are solely responsible for your own trading decisions. Always do your own research, use proper risk management, and consider consulting a licensed financial professional before making any financial decisions.
By using this script, you agree that the author and NeBlok are not liable for any losses or damages resulting from its use.
OVERVIEW
Delta Flow Profile 3D shows where buyers and sellers were aggressive inside a lookback window, and at which prices. It combines four tools in one overlay:
1. A 3D delta profile that shows net buying or selling at each price level
2. A Point of Control (POC) and Value Area built from total volume
3. Delta spike detection that flags bars with unusually strong buying or selling
4. Imbalance levels anchored to each spike, drawn as 3D plates that stay on the chart until price returns to them
The goal is to show not just where volume traded, but who was in control at each price.
HOW THE DELTA IS CALCULATED
Delta is the difference between buying volume and selling volume. This script estimates it in one of two ways, selected under Delta Method:
- Intrabar (default and recommended): The script requests lower-timeframe bars inside each chart bar. Each intrabar is classified as buying if it closed above its open, or selling if it closed below its open. When an intrabar opens and closes at the same price, the script compares its close to the previous intrabar's close (the tick rule). Adding these up gives a more detailed buy/sell estimate than the chart bar alone can provide.
- Bar Geometry: Each bar's volume is split by where it closed within its high-low range. A close near the high counts mostly as buying, and a close near the low counts mostly as selling. This works on any symbol and timeframe but is less precise.
If Intrabar mode is selected but lower-timeframe data is not available for a bar, that bar automatically falls back to Bar Geometry. The summary label shows the "Intrabar coverage" percentage so you always know how much of the profile is built from intrabar data. Higher is better.
Automatic intrabar timeframe selection (when the Intrabar Timeframe input is left blank):
- Chart at 1 minute or lower: the chart's own timeframe
- Chart up to 1 hour: 1 minute
- Chart up to 4 hours: 5 minutes
- Chart up to 1 day: 15 minutes
- Higher timeframes: 60 minutes
Important: This is an ESTIMATE of order flow built from price and volume data. It is not true bid/ask footprint data from the exchange.
READING THE 3D PROFILE
The profile sits to the right of current price and is split by a vertical dotted axis.
- Bars extending RIGHT of the axis (buy color) = net buying at that price level
- Bars extending LEFT of the axis (sell color) = net selling at that price level
- Bar length = the size of the net delta at that price compared with the largest row in the profile
- Yellow row = POC, the price level with the most total volume (buying plus selling) in the window
- Brighter rows = inside the Value Area (70% of total volume by default)
- Dimmed rows = outside the Value Area
A dotted POC line extends from the start of the lookback window to the profile, so you can see how price has interacted with it over time.
A 3D frame outlines the lookback window, so you can see exactly which bars the profile is measuring.
How traders commonly read it:
- Strong buying below current price can show where buyers defended.
- Strong selling above current price can show where sellers were active.
- The POC is often treated as a "fair value" area that price tends to revisit.
- The Value Area edges mark where most business was done. Moves outside the Value Area are often watched for acceptance (price holds there) or rejection (price returns inside).
- A price level with high total volume but near-zero delta means buyers and sellers were evenly matched there.
DELTA SPIKES (GLOW PILLARS)
A delta spike is a bar whose delta is a statistical outlier compared with recent bars. The script measures this with a z-score over the Spike Baseline Length (default 100 bars).
- Buy-colored pillar = unusually strong buying on that bar
- Sell-colored pillar = unusually strong selling on that bar
Because the threshold is based on standard deviations rather than a fixed volume number, it adapts to each symbol's normal activity. A spike on a thinly traded stock and a spike on a heavily traded index future are both measured against their own recent behavior.
Pillars are only drawn inside the lookback window.
IMBALANCE LEVELS (3D PLATES)
Every delta spike creates an imbalance level. The level is placed at the spike bar's intrabar VWAP (volume-weighted average price), which estimates where the aggressive volume actually traded. With Bar Geometry, it uses the bar's typical price instead.
- Buy-colored plates come from bullish spikes. They are watched as potential support.
- Sell-colored plates come from bearish spikes. They are watched as potential resistance.
- An active level extends to the right on every new bar until price comes back to it.
- Once price returns (mitigation), the level stops extending. If "Keep Mitigated Levels" is on, it stays on the chart in a faded color for reference.
Mitigation Trigger:
- Wick: The level is mitigated as soon as price trades through it (low below a bullish level, or high above a bearish level). This is more sensitive.
- Close: The level is mitigated only when a bar closes through it. This is more forgiving.
How traders commonly use these levels:
- As areas to watch for a reaction when price returns
- As confluence when a level lines up with the POC, a Value Area edge, or a large profile row
- As a record of where strong participants stepped in
An unmitigated level is not a guaranteed reaction point. Treat it as an area of interest, not a signal on its own.
SETTINGS GUIDE
Delta Engine
- Delta Method: Intrabar (more accurate) or Bar Geometry (works everywhere)
- Intrabar Timeframe: Leave blank for automatic, or set your own. If you choose a timeframe higher than the chart's, the script uses the chart timeframe instead.
Profile
- Lookback Bars (default 300): How many bars the profile, frame, and spike pillars cover
- Rows (default 28): Number of price levels. More rows give finer detail, fewer rows give a smoother picture.
- Max Bar Length (default 45): Length in bars of the largest row
- Offset From Last Bar (default 15): Gap between the current bar and the profile
- Value Area % (default 70): Share of total volume included in the Value Area
- Highlight POC + POC Line: Turns the yellow POC row and the POC line on or off
- Dim Rows Outside Value Area: Fades rows outside the Value Area
- Show Row Delta Values: Prints the net delta number beside each row
- Show Summary Label: Shows net delta, POC, Value Area range, and intrabar coverage
3D Style
- Depth X: Horizontal depth of the 3D effect, in bars
- Depth Y: Vertical depth of the 3D effect, as a multiple of row height
- Show 3D Window Frame: Turns the lookback frame on or off
Set both depth values to 0 for a flat 2D look.
Delta Spikes & Levels
- Show Delta Spike Pillars: Turns the pillars on or off
- Spike Baseline Length (default 100): Number of bars used to define "normal" delta
- Spike Threshold (default 2.5): Z-score required to count as a spike. Raise it for fewer, stronger spikes. Lower it for more frequent signals.
- Show Imbalance Levels: Turns the plates on or off
- Max Levels (default 20): Maximum number of levels kept on the chart
- Mitigation Trigger: Wick or Close
- Keep Mitigated Levels: Keeps or removes levels after price returns to them
Colors
- Buy Delta, Sell Delta, POC, and Frame/Axis colors are all adjustable.
Data Window
- "Bar Delta" and "Delta Z-Score" for each bar appear in the Data Window. You can use them to check how strong any individual bar was.
ALERTS
The script includes four alerts, each evaluated once per bar close:
- Bullish delta spike (includes the delta value and level price)
- Bearish delta spike (includes the delta value and level price)
- Price returned to a bullish imbalance level
- Price returned to a bearish imbalance level
To set them up: open the Alerts panel, choose this indicator as the condition, and select "Any alert() function call."
TIPS FOR BEST RESULTS
- Use symbols with reliable volume data: stocks, ETFs, futures, and crypto. The script stops with an error if the symbol has no volume data.
- Watch the Intrabar coverage percentage. TradingView limits how much lower-timeframe history is available, so older bars in a long lookback may fall back to Bar Geometry. Shorter lookbacks or a higher intrabar timeframe usually improve coverage.
- The profile spreads each bar's buy and sell volume evenly across that bar's high-low range. Using more bars in the lookback and a moderate row count gives a more stable picture.
- Spikes and levels on the live, unfinished bar can appear and disappear as the bar develops. They are final only once the bar closes.
- The profile, POC, Value Area, and frame are redrawn on every new bar as the lookback window moves forward.
- This tool works best as context alongside your own analysis, market structure, and risk management, not as a standalone entry signal.
DISCLAIMER
This indicator is provided free for educational and informational purposes only. It is not financial advice, investment advice, trading advice, or a recommendation to buy or sell any security, futures contract, or other financial instrument.
Order flow and delta values in this script are estimates built from price and volume data and may not reflect actual exchange-level buy and sell activity. Signals, levels, and alerts can be wrong, can change on the live bar, and may behave differently on different symbols, timeframes, and data feeds.
Trading involves substantial risk of loss and is not suitable for everyone. Past performance, whether actual or shown by any indicator, does not guarantee future results. You are solely responsible for your own trading decisions. Always do your own research, use proper risk management, and consider consulting a licensed financial professional before making any financial decisions.
By using this script, you agree that the author and NeBlok are not liable for any losses or damages resulting from its use.

إخلاء المسؤولية
لا يُقصد بالمعلومات والمنشورات أن تكون، أو تشكل، أي نصيحة مالية أو استثمارية أو تجارية أو أنواع أخرى من النصائح أو التوصيات المقدمة أو المعتمدة من TradingView. اقرأ المزيد في شروط الاستخدام.
إخلاء المسؤولية
لا يُقصد بالمعلومات والمنشورات أن تكون، أو تشكل، أي نصيحة مالية أو استثمارية أو تجارية أو أنواع أخرى من النصائح أو التوصيات المقدمة أو المعتمدة من TradingView. اقرأ المزيد في شروط الاستخدام.