تم تحديثه
[blackcat] L3 Jurik MACD
Level: 3
Background
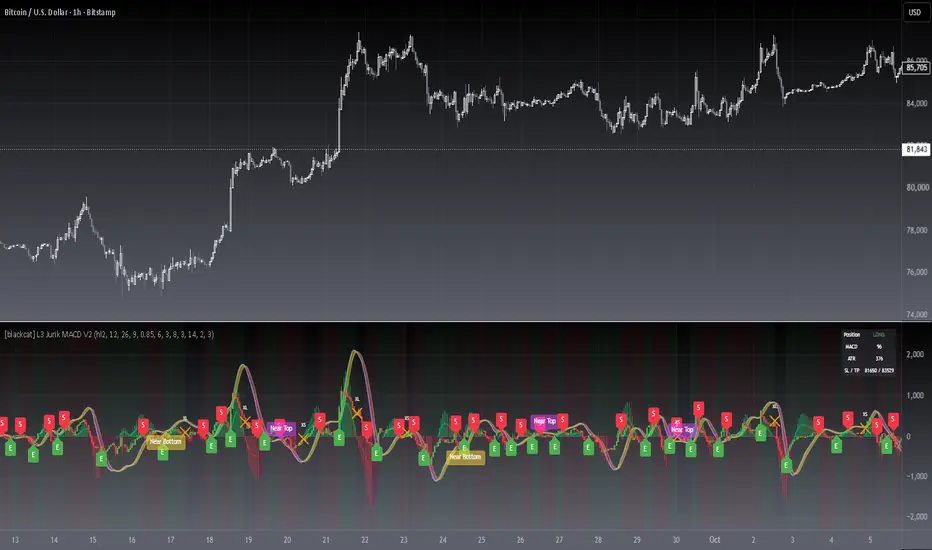
Use Jurik MA to build MACD and many people need to judge the market trend against the main candlestick chart when using MACD .
Function
First of all, the MACD function is built with Jurik MA and ALMA for better performance.
Second, the principle of MACD is the difference between EMA's long-term and short-term values. So, I wonder if it is possible to use EMA to construct a set of candle charts that are similar in proportion to MACD values for overlapping comparisons? Because this can greatly facilitate traders to make quick trend judgments. So I used the 3-8 lines of EMA to simulate the KD of KDJ, constructed a set of candle charts, and generated buying and selling points through conditional constraints. Do you like this MACD + Candlestick chart?
Key Signal
Traditional Jurik MACD output signal
Candlesticks
Near Top --> Top is reached and reversal may happen soon. (fuchsia labels)
Near Bottom --> Bottom is reached and reversal may happen soon. (yellow labels)
Remarks
Feedbacks are appreciated.
Background
Use Jurik MA to build MACD and many people need to judge the market trend against the main candlestick chart when using MACD .
Function
First of all, the MACD function is built with Jurik MA and ALMA for better performance.
Second, the principle of MACD is the difference between EMA's long-term and short-term values. So, I wonder if it is possible to use EMA to construct a set of candle charts that are similar in proportion to MACD values for overlapping comparisons? Because this can greatly facilitate traders to make quick trend judgments. So I used the 3-8 lines of EMA to simulate the KD of KDJ, constructed a set of candle charts, and generated buying and selling points through conditional constraints. Do you like this MACD + Candlestick chart?
Key Signal
Traditional Jurik MACD output signal
Candlesticks
Near Top --> Top is reached and reversal may happen soon. (fuchsia labels)
Near Bottom --> Bottom is reached and reversal may happen soon. (yellow labels)
Remarks
Feedbacks are appreciated.
ملاحظات الأخبار
OVERVIEWThe L3 Jurik MACD indicator combines advanced moving average calculations with traditional MACD analysis to provide traders with comprehensive market insights. This sophisticated tool uses the Jurik Moving Average algorithm for more accurate trend identification compared to standard indicators. The script includes dynamic histogram coloring, customizable alerts, and visual price action analysis through EMA differences.
FEATURES
• Advanced Jurik Moving Average implementation
• Customizable MACD parameters (Fast: 12, Slow: 26, Signal: 9)
• Dynamic histogram coloring based on momentum changes
• Real-time trading signals and crossover detection
• Price action analysis using multiple EMAs
• Visual alerts for buy/sell opportunities
• Zone monitoring for potential tops/bottoms
HOW TO USE
Apply the indicator to your chart:
Add the L3 Jurik MACD indicator to any timeframe of choice.
Interpret the signals:
• MACD Line: Primary trend direction indicator
• Signal Line: Crossover points generate entry signals
• Histogram: Shows momentum strength and direction
• EMA Differences: Color-coded candles indicate bullish/bearish trends
Monitor zones:
• Look for "Near Top" or "Near Bottom" labels for potential reversal areas
• Pay attention to crossover events between MACD lines
Configure alerts:
• Customize notification settings in TradingView's alert manager
• Set up email/SMS notifications for trade signals
LIMITATIONS
• May produce false signals during highly volatile periods
• Best suited for longer timeframes due to calculation complexity
• Requires careful parameter tuning for optimal performance
• Historical data dependency may affect accuracy
NOTES
The indicator works best when combined with other technical tools
Adjust parameters according to your trading strategy requirements
Consider market conditions before relying solely on this indicator
ملاحظات الأخبار
█ OVERVIEWL1 Chop Zones V2 is a momentum-based market-state oscillator that divides the 0-100 trend-strength scale into five trading zones. It tells you at a glance whether conditions favor longs, shorts, both directions, or no trading at all.
This V2 release keeps the original zone engine and adds a live status table, zone-change markers, background highlighting, and entry alerts.
█ CONCEPTS
The script computes a composite trend-strength score (0-100) from smoothed stochastic-style price positioning, then maps the score into zones:
• LONG & SHORT — extreme readings (below 20 or above 80): strong momentum, both directions tradable
• SHORT ONLY — 20 to 40: bearish drift, favor shorts
• NO TRADE — 40 to 60: chop zone, stand aside
• LONG ONLY — 60 to 80: bullish drift, favor longs
A 101-stop blue-to-magenta gradient paints the main line based on RSI applied to a 21-period ALMA, so line color independently encodes momentum.
█ HOW TO USE
1 — Add the script to your chart; it runs in a separate pane.
2 — Read the thick gradient line against the dotted threshold lines and shaded zones.
3 — Check the status table (middle right) for the exact trend-strength value, active zone, RSI reading, and ALMA slope.
4 — Optionally create alerts for zone entries.
Input Parameters
• Source Price — price series driving all calculations (default: close)
• % Distance Thresholds (Long/Short, Center/Lower/Upper) — zone boundaries, defaults 60 / 20 / 40 / 80
• Show Status Table / Highlight Active Zone Background / Mark Zone Changes — display toggles
█ FEATURES
• Live status table: trend strength, current zone, RSI (ALMA 21), ALMA slope, plus a zone legend showing your thresholds
• Zone-change dots marking every zone transition on the line
• Background tint matching the active zone
• Four alertcondition alerts: entry into LONG ONLY, SHORT ONLY, NO TRADE, and the two-way extreme zone
• All thresholds constrained to 0-100 with sane min/max guards
█ SIGNALS
• Line climbing through 60 into the green fill — long-bias zone
• Line falling through 40 into the red fill — short-bias zone
• Line inside the grey center band — chop, avoid new entries
• Dot markers — zone just changed; re-evaluate positioning
• Background color — instant read of the active zone without checking the table
█ LIMITATIONS
• Oscillator-based: readings can stay pinned in extreme zones during strong trends
• Not a standalone system — combine with market structure, volatility, and risk management
• Needs a warm-up period before values stabilize on newly loaded charts
█ NOTES
• V2 enhancement of blackcat1402's original L1 Chop Zones: input sanitization, runtime hardening, dead-code removal, plus the status table, markers, background, and alerts
• Licensed under the Mozilla Public License 2.0
════════════════════════════════════════════════════════════════════════
For questions or feedback, please use the comments section below.
Feel free to use and modify — attribution appreciated.

Don't miss out! The first and most important thing to do is to join my Discord chat now! Click here to start your adventure: discord.com/invite/ZTGpQJq My new github for more pine development soon: github.com/wxt-coder
إخلاء المسؤولية
لا يُقصد بالمعلومات والمنشورات أن تكون، أو تشكل، أي نصيحة مالية أو استثمارية أو تجارية أو أنواع أخرى من النصائح أو التوصيات المقدمة أو المعتمدة من TradingView. اقرأ المزيد في شروط الاستخدام.
Don't miss out! The first and most important thing to do is to join my Discord chat now! Click here to start your adventure: discord.com/invite/ZTGpQJq My new github for more pine development soon: github.com/wxt-coder
إخلاء المسؤولية
لا يُقصد بالمعلومات والمنشورات أن تكون، أو تشكل، أي نصيحة مالية أو استثمارية أو تجارية أو أنواع أخرى من النصائح أو التوصيات المقدمة أو المعتمدة من TradingView. اقرأ المزيد في شروط الاستخدام.