OPEN-SOURCE SCRIPT
تم تحديثه DANI _ MTF Pullback - RSI Panel
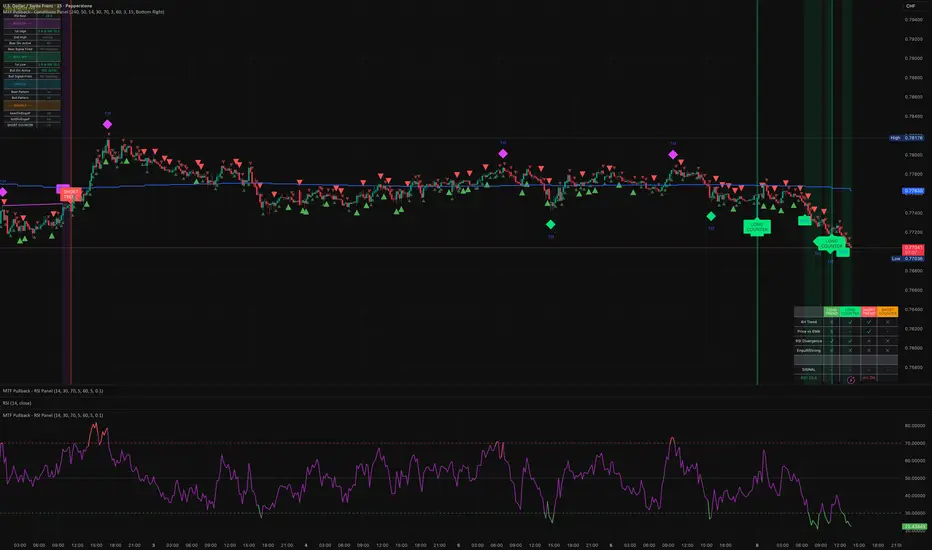
MTF Pullback - RSI Panel Summary
Purpose: Companion indicator for the main strategy that displays RSI with divergence detection in a separate pane below the price chart.
Settings
ParameterDefaultDescriptionRSI Length14Lookback period for RSI calculationRSI Oversold Level30Threshold for oversold conditionRSI Overbought Level70Threshold for overbought conditionDivergence Lookback Bars10How many bars to look back for divergence detection
What It Displays
RSI Line — Changes color based on zone:
Purple = neutral (between 30-70)
Green = oversold (below 30)
Red = overbought (above 70)
Horizontal Levels:
Red dashed line at 70 (overbought)
Green dashed line at 30 (oversold)
Gray dotted line at 50 (midpoint)
Zone Fills:
Light red shading above 70
Light green shading below 30
Divergence Markers:
"DIV" label with lime circle = bullish divergence (price makes lower low, RSI makes higher low while oversold)
"DIV" label with fuchsia circle = bearish divergence (price makes higher high, RSI makes lower high while overbought)
Background Flash:
Green flash when bullish divergence detected
Red flash when bearish divergence detected
Divergence Logic
Bullish: Price makes a lower low AND RSI makes a higher low AND RSI is in oversold territory → potential reversal up
Bearish: Price makes a higher high AND RSI makes a lower high AND RSI is in overbought territory → potential reversal down
Purpose: Companion indicator for the main strategy that displays RSI with divergence detection in a separate pane below the price chart.
Settings
ParameterDefaultDescriptionRSI Length14Lookback period for RSI calculationRSI Oversold Level30Threshold for oversold conditionRSI Overbought Level70Threshold for overbought conditionDivergence Lookback Bars10How many bars to look back for divergence detection
What It Displays
RSI Line — Changes color based on zone:
Purple = neutral (between 30-70)
Green = oversold (below 30)
Red = overbought (above 70)
Horizontal Levels:
Red dashed line at 70 (overbought)
Green dashed line at 30 (oversold)
Gray dotted line at 50 (midpoint)
Zone Fills:
Light red shading above 70
Light green shading below 30
Divergence Markers:
"DIV" label with lime circle = bullish divergence (price makes lower low, RSI makes higher low while oversold)
"DIV" label with fuchsia circle = bearish divergence (price makes higher high, RSI makes lower high while overbought)
Background Flash:
Green flash when bullish divergence detected
Red flash when bearish divergence detected
Divergence Logic
Bullish: Price makes a lower low AND RSI makes a higher low AND RSI is in oversold territory → potential reversal up
Bearish: Price makes a higher high AND RSI makes a lower high AND RSI is in overbought territory → potential reversal down
ملاحظات الأخبار
updatesrملاحظات الأخبار
updates dfنص برمجي مفتوح المصدر
بروح TradingView الحقيقية، قام مبتكر هذا النص البرمجي بجعله مفتوح المصدر، بحيث يمكن للمتداولين مراجعة وظائفه والتحقق منها. شكرا للمؤلف! بينما يمكنك استخدامه مجانًا، تذكر أن إعادة نشر الكود يخضع لقواعد الموقع الخاصة بنا.

إخلاء المسؤولية
لا يُقصد بالمعلومات والمنشورات أن تكون، أو تشكل، أي نصيحة مالية أو استثمارية أو تجارية أو أنواع أخرى من النصائح أو التوصيات المقدمة أو المعتمدة من TradingView. اقرأ المزيد في شروط الاستخدام.
نص برمجي مفتوح المصدر
بروح TradingView الحقيقية، قام مبتكر هذا النص البرمجي بجعله مفتوح المصدر، بحيث يمكن للمتداولين مراجعة وظائفه والتحقق منها. شكرا للمؤلف! بينما يمكنك استخدامه مجانًا، تذكر أن إعادة نشر الكود يخضع لقواعد الموقع الخاصة بنا.
إخلاء المسؤولية
لا يُقصد بالمعلومات والمنشورات أن تكون، أو تشكل، أي نصيحة مالية أو استثمارية أو تجارية أو أنواع أخرى من النصائح أو التوصيات المقدمة أو المعتمدة من TradingView. اقرأ المزيد في شروط الاستخدام.