CT - Maybe the Price Is Wrong
CT — Maybe the Price Is Wrong™
Statistical Dislocation & Relative Performance Observatory
The market says the price is right. The statistics suggest we might want a second opinion.
A stock can fall 20% and still outperform its sector. Another can rise 10% while its peers gain 30%. So which one is actually looking cheap?
CT — Maybe the Price Is Wrong™ investigates when a stock's performance becomes unusually depressed relative to a chosen benchmark, and what historically happened after similar extremes.
It doesn't claim to identify intrinsic value or predict reversals. It measures statistical dislocations and lets the evidence speak.
WHAT IT DOES
Choose any stock and compare it against an ETF, index or custom basket of up to 12 stocks.
Exclude selected constituents and use proportional or equal weighting to create your own comparison universe.
Identify relative extremes using rolling Z-scores and historical percentiles. Large red diamonds mark new extreme-discount episodes.
Study what happened next over 5, 10, 20 and 60 trading days.
Compare outcomes against normal conditions using EVENT (post-extreme return), BASE (unconditional return) and EDGE (their difference).
Monitor statistical stability through distribution-shift diagnostics and separate clustered events using a configurable cooldown.
EXAMPLE: GOOGL VS TECHNOLOGY WITHOUT SEMICONDUCTORS
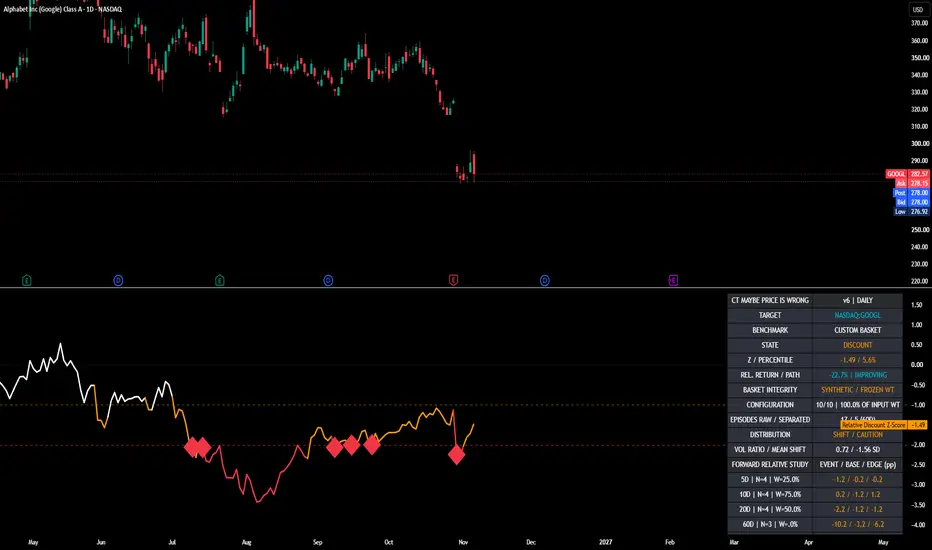
The accompanying chart (above) compares Alphabet against a selected basket of non-semiconductor technology stocks.
White indicates normal relative performance; orange indicates discount territory (Z ≤ −1); red indicates extreme territory (Z ≤ −2).
Large red diamonds mark the beginning of new extreme episodes. Multiple diamonds can occur during one broader period of weakness, so the forward study uses cooldown-separated observations.
The question isn't whether GOOGL looks cheap. It's whether unusually poor relative performance has historically been followed by meaningful relative recovery.
HOW TO USE IT
Select your stock and benchmark. If using a custom basket, configure the constituents, weights and exclusions. Then examine the Z-score, percentile, red diamonds and historical forward outcomes.
A positive EDGE means extreme episodes historically outperformed the unconditional sample—not that you've discovered a profitable trading strategy.
RESEARCH DISCLOSURE
This is an experimental, open-source research tool, not investment advice or a buy/sell system. Statistical discounts are not fundamental valuations, and historical outcomes are not independently validated predictions.
Custom baskets use fixed user-defined constituents and weights, not historical point-in-time ETF holdings. Results may therefore be affected by benchmark selection, look-ahead bias, overlapping observations and changing market regimes.
The code is published for transparency, scrutiny and further research.
Measure the dislocation. Examine the outcome. Test the relationship.
© 2026 ComplexityTrading. Mozilla Public License 2.0.
Statistical Dislocation & Relative Performance Observatory
The market says the price is right. The statistics suggest we might want a second opinion.
A stock can fall 20% and still outperform its sector. Another can rise 10% while its peers gain 30%. So which one is actually looking cheap?
CT — Maybe the Price Is Wrong™ investigates when a stock's performance becomes unusually depressed relative to a chosen benchmark, and what historically happened after similar extremes.
It doesn't claim to identify intrinsic value or predict reversals. It measures statistical dislocations and lets the evidence speak.
WHAT IT DOES
Choose any stock and compare it against an ETF, index or custom basket of up to 12 stocks.
Exclude selected constituents and use proportional or equal weighting to create your own comparison universe.
Identify relative extremes using rolling Z-scores and historical percentiles. Large red diamonds mark new extreme-discount episodes.
Study what happened next over 5, 10, 20 and 60 trading days.
Compare outcomes against normal conditions using EVENT (post-extreme return), BASE (unconditional return) and EDGE (their difference).
Monitor statistical stability through distribution-shift diagnostics and separate clustered events using a configurable cooldown.
EXAMPLE: GOOGL VS TECHNOLOGY WITHOUT SEMICONDUCTORS
The accompanying chart (above) compares Alphabet against a selected basket of non-semiconductor technology stocks.
White indicates normal relative performance; orange indicates discount territory (Z ≤ −1); red indicates extreme territory (Z ≤ −2).
Large red diamonds mark the beginning of new extreme episodes. Multiple diamonds can occur during one broader period of weakness, so the forward study uses cooldown-separated observations.
The question isn't whether GOOGL looks cheap. It's whether unusually poor relative performance has historically been followed by meaningful relative recovery.
HOW TO USE IT
Select your stock and benchmark. If using a custom basket, configure the constituents, weights and exclusions. Then examine the Z-score, percentile, red diamonds and historical forward outcomes.
A positive EDGE means extreme episodes historically outperformed the unconditional sample—not that you've discovered a profitable trading strategy.
RESEARCH DISCLOSURE
This is an experimental, open-source research tool, not investment advice or a buy/sell system. Statistical discounts are not fundamental valuations, and historical outcomes are not independently validated predictions.
Custom baskets use fixed user-defined constituents and weights, not historical point-in-time ETF holdings. Results may therefore be affected by benchmark selection, look-ahead bias, overlapping observations and changing market regimes.
The code is published for transparency, scrutiny and further research.
Measure the dislocation. Examine the outcome. Test the relationship.
© 2026 ComplexityTrading. Mozilla Public License 2.0.

Structural market diagnostics for regime shifts, fragility, and cross-asset behavior. Models interpret liquidity, volatility, phase, and scale-invariant structure to reveal internal state. Some work is open on TradingView; deeper research lives elsewhere
إخلاء المسؤولية
لا يُقصد بالمعلومات والمنشورات أن تكون، أو تشكل، أي نصيحة مالية أو استثمارية أو تجارية أو أنواع أخرى من النصائح أو التوصيات المقدمة أو المعتمدة من TradingView. اقرأ المزيد في شروط الاستخدام.
Structural market diagnostics for regime shifts, fragility, and cross-asset behavior. Models interpret liquidity, volatility, phase, and scale-invariant structure to reveal internal state. Some work is open on TradingView; deeper research lives elsewhere
إخلاء المسؤولية
لا يُقصد بالمعلومات والمنشورات أن تكون، أو تشكل، أي نصيحة مالية أو استثمارية أو تجارية أو أنواع أخرى من النصائح أو التوصيات المقدمة أو المعتمدة من TradingView. اقرأ المزيد في شروط الاستخدام.