OPEN-SOURCE SCRIPT
تم تحديثه IPDA Ranges Pro
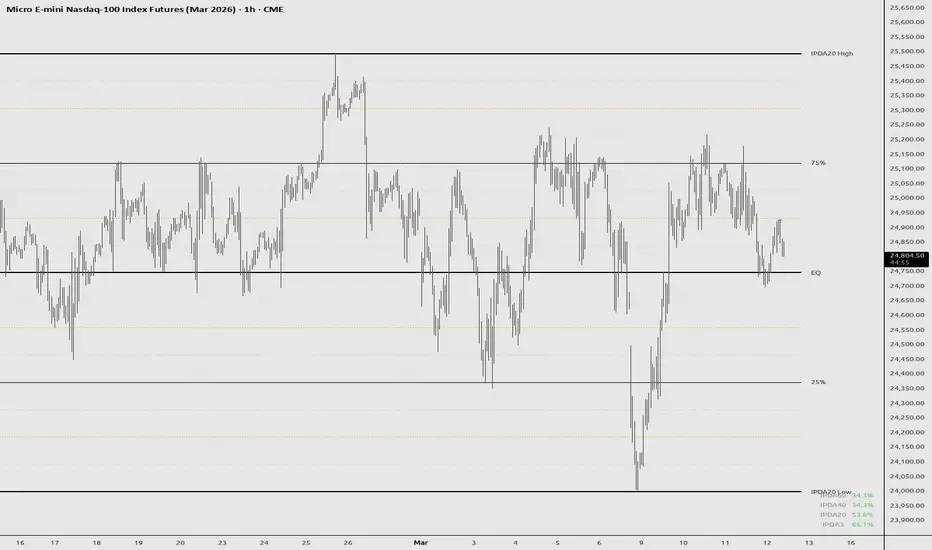
IPDA Ranges – Pro
This indicator plots Institutional Price Delivery Algorithm (IPDA) ranges based on lookback periods of 20, 40, and 60 days, as taught by ICT (Inner Circle Trader). It visualizes premium and discount zones, equilibrium levels, quadrants, and sub-quadrants to help traders identify key price areas and potential market biases.
Key Features:
- Displays IPDA ranges as boxes or lines, with customizable colors for discount, equilibrium, and premium zones.
- Optionally shades the 25%-75% mid-zone for each range.
- Supports quadrants (25% steps) and sub-quadrants with lines and labels for detailed price segmentation.
- Includes a table displaying either discount/premium status or percentage from equilibrium for each range.
- Configurable alerts for entry/exit into the mid-zone.
- Visual options include line styles, label sizes, price display on labels, and buffers for zone extension.
Settings Overview:
- IPDA Intervals: Enable/disable IPDA20, IPDA40, IPDA60; toggle quadrants, sub-quadrants, mid-zone shading, and drawing with lines vs. boxes.
- Colors and Styles: Customize colors for zones, lines, labels; select solid/dotted/dashed styles for borders and lines.
- Appearance: Adjust label and table sizes, table position, and background opacity.
- Labels: Show/hide per-range labels and include prices.
- Alerts: Enable mid-zone entry/exit alerts.
- Includes 3-Day Lookback
Usage:
Add the indicator to your chart and select the desired IPDA intervals. The ranges update dynamically based on daily highs and lows. Use the table for quick reference to current positioning (discount/premium or percentage). The mid-zone shading helps identify consolidation areas, while quadrants and sub-quadrants assist in pinpointing potential support/resistance levels.
© MadMonkTrading
This indicator plots Institutional Price Delivery Algorithm (IPDA) ranges based on lookback periods of 20, 40, and 60 days, as taught by ICT (Inner Circle Trader). It visualizes premium and discount zones, equilibrium levels, quadrants, and sub-quadrants to help traders identify key price areas and potential market biases.
Key Features:
- Displays IPDA ranges as boxes or lines, with customizable colors for discount, equilibrium, and premium zones.
- Optionally shades the 25%-75% mid-zone for each range.
- Supports quadrants (25% steps) and sub-quadrants with lines and labels for detailed price segmentation.
- Includes a table displaying either discount/premium status or percentage from equilibrium for each range.
- Configurable alerts for entry/exit into the mid-zone.
- Visual options include line styles, label sizes, price display on labels, and buffers for zone extension.
Settings Overview:
- IPDA Intervals: Enable/disable IPDA20, IPDA40, IPDA60; toggle quadrants, sub-quadrants, mid-zone shading, and drawing with lines vs. boxes.
- Colors and Styles: Customize colors for zones, lines, labels; select solid/dotted/dashed styles for borders and lines.
- Appearance: Adjust label and table sizes, table position, and background opacity.
- Labels: Show/hide per-range labels and include prices.
- Alerts: Enable mid-zone entry/exit alerts.
- Includes 3-Day Lookback
Usage:
Add the indicator to your chart and select the desired IPDA intervals. The ranges update dynamically based on daily highs and lows. Use the table for quick reference to current positioning (discount/premium or percentage). The mid-zone shading helps identify consolidation areas, while quadrants and sub-quadrants assist in pinpointing potential support/resistance levels.
© MadMonkTrading
ملاحظات الأخبار
1. Fixed left buffer to coincide with the actual IPDA range.ملاحظات الأخبار
1. Changed 3 day look-back from static to full customization of any range by both time frame and how many periods look-back. Includes optional gradient levels of the last period of look-back.2. Added option to include current period within the range or exclude the current period from the range.
3. Added optional vertical separators for Weekly, Daily, and Custom time frame.
Here is a chart example of how I use the custom range function:
15m chart includes a 3-day lookback
1h chart includes a 3-week lookback.
نص برمجي مفتوح المصدر
بروح TradingView الحقيقية، قام مبتكر هذا النص البرمجي بجعله مفتوح المصدر، بحيث يمكن للمتداولين مراجعة وظائفه والتحقق منها. شكرا للمؤلف! بينما يمكنك استخدامه مجانًا، تذكر أن إعادة نشر الكود يخضع لقواعد الموقع الخاصة بنا.

إخلاء المسؤولية
لا يُقصد بالمعلومات والمنشورات أن تكون، أو تشكل، أي نصيحة مالية أو استثمارية أو تجارية أو أنواع أخرى من النصائح أو التوصيات المقدمة أو المعتمدة من TradingView. اقرأ المزيد في شروط الاستخدام.
نص برمجي مفتوح المصدر
بروح TradingView الحقيقية، قام مبتكر هذا النص البرمجي بجعله مفتوح المصدر، بحيث يمكن للمتداولين مراجعة وظائفه والتحقق منها. شكرا للمؤلف! بينما يمكنك استخدامه مجانًا، تذكر أن إعادة نشر الكود يخضع لقواعد الموقع الخاصة بنا.
إخلاء المسؤولية
لا يُقصد بالمعلومات والمنشورات أن تكون، أو تشكل، أي نصيحة مالية أو استثمارية أو تجارية أو أنواع أخرى من النصائح أو التوصيات المقدمة أو المعتمدة من TradingView. اقرأ المزيد في شروط الاستخدام.