OPEN-SOURCE SCRIPT
تم تحديثه Cumulative Volume Delta
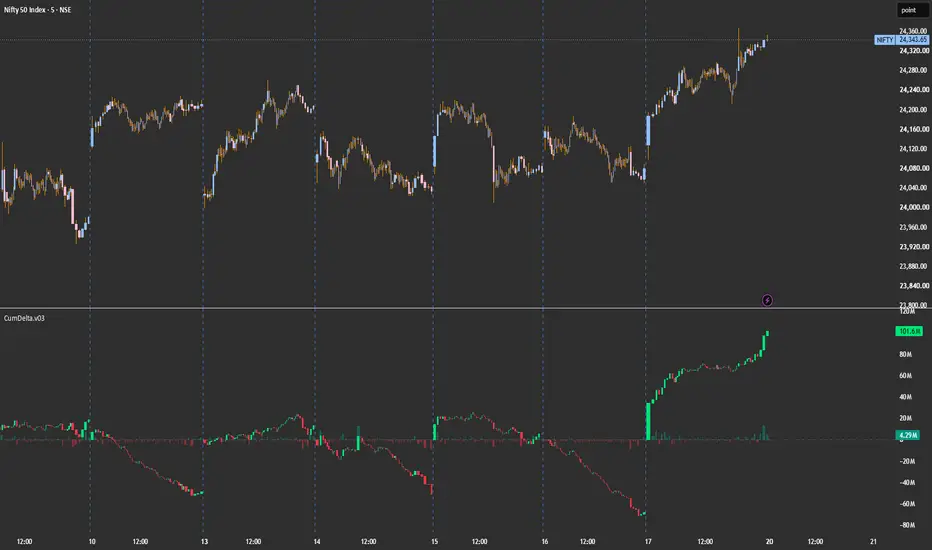
CumDelta — Cumulative Volume Delta with Session Reset
A clean cumulative volume delta (CVD) indicator that visualizes the running balance of buying vs. selling aggression using lower-timeframe up/down volume. Designed for intraday traders who want to read order flow alongside price.
What it does
Each bar's delta is calculated by pulling lower-timeframe volume data and classifying it as buying or selling pressure based on whether each sub-bar closed up or down. These per-bar deltas are then cumulated into a running total that resets on your chosen schedule (day, session, week, month, year, or N bars back).
The cumulative delta is rendered as candles — each candle's open chains from the previous close, and the body shows whether net flow on that bar was positive or negative. A histogram below shows the raw per-bar delta for quick reference.
How to read it
Rising green candles — sustained buying pressure
Falling red candles — sustained selling pressure
Divergence vs. price — price makes a new high but CVD doesn't (or vice versa) often precedes reversals
Reset bars (optional yellow highlight) — fresh session start, useful for marking where the cumulation restarts
Settings
Reset Period — Day, Session (RTH-aware), Week, Month, Year, or Bars Back
Lower Timeframe — auto-selects based on chart TF, or set manually for finer/coarser resolution
Doji Handling — choose how to attribute volume when a bar closes flat (Split 50/50, Up, Down, or Skip)
Display toggles — bar delta histogram, cumulative candles, reset markers
A clean cumulative volume delta (CVD) indicator that visualizes the running balance of buying vs. selling aggression using lower-timeframe up/down volume. Designed for intraday traders who want to read order flow alongside price.
What it does
Each bar's delta is calculated by pulling lower-timeframe volume data and classifying it as buying or selling pressure based on whether each sub-bar closed up or down. These per-bar deltas are then cumulated into a running total that resets on your chosen schedule (day, session, week, month, year, or N bars back).
The cumulative delta is rendered as candles — each candle's open chains from the previous close, and the body shows whether net flow on that bar was positive or negative. A histogram below shows the raw per-bar delta for quick reference.
How to read it
Rising green candles — sustained buying pressure
Falling red candles — sustained selling pressure
Divergence vs. price — price makes a new high but CVD doesn't (or vice versa) often precedes reversals
Reset bars (optional yellow highlight) — fresh session start, useful for marking where the cumulation restarts
Settings
Reset Period — Day, Session (RTH-aware), Week, Month, Year, or Bars Back
Lower Timeframe — auto-selects based on chart TF, or set manually for finer/coarser resolution
Doji Handling — choose how to attribute volume when a bar closes flat (Split 50/50, Up, Down, or Skip)
Display toggles — bar delta histogram, cumulative candles, reset markers
ملاحظات الأخبار
-Bug Fixنص برمجي مفتوح المصدر
بروح TradingView الحقيقية، قام مبتكر هذا النص البرمجي بجعله مفتوح المصدر، بحيث يمكن للمتداولين مراجعة وظائفه والتحقق منها. شكرا للمؤلف! بينما يمكنك استخدامه مجانًا، تذكر أن إعادة نشر الكود يخضع لقواعد الموقع الخاصة بنا.

إخلاء المسؤولية
لا يُقصد بالمعلومات والمنشورات أن تكون، أو تشكل، أي نصيحة مالية أو استثمارية أو تجارية أو أنواع أخرى من النصائح أو التوصيات المقدمة أو المعتمدة من TradingView. اقرأ المزيد في شروط الاستخدام.
نص برمجي مفتوح المصدر
بروح TradingView الحقيقية، قام مبتكر هذا النص البرمجي بجعله مفتوح المصدر، بحيث يمكن للمتداولين مراجعة وظائفه والتحقق منها. شكرا للمؤلف! بينما يمكنك استخدامه مجانًا، تذكر أن إعادة نشر الكود يخضع لقواعد الموقع الخاصة بنا.
إخلاء المسؤولية
لا يُقصد بالمعلومات والمنشورات أن تكون، أو تشكل، أي نصيحة مالية أو استثمارية أو تجارية أو أنواع أخرى من النصائح أو التوصيات المقدمة أو المعتمدة من TradingView. اقرأ المزيد في شروط الاستخدام.