OPEN-SOURCE SCRIPT
Momentum Confluence System
Credit: This indicator builds upon the Moving Average Shaded
Fill Area Crossover concept originally developed by aballard11 The core visual
approach of using filled EMA ribbons to represent trend states was adapted and
significantly expanded with institutional-grade filtering, multi-layered
confluence logic, and professional risk management tools.
What This Indicator Does
The Momentum Confluence System is a multi-timeframe
trend-following indicator designed for day trading across all markets. It
identifies high-probability trade entries by requiring alignment across three
distinct layers of analysis before generating a signal:

-Macro Layer: A higher-timeframe directional filter that
determines whether the broader trend favors longs or shorts
-Slow Momentum Layer: An intermediate EMA ribbon that
confirms the underlying trend on the current timeframe
-Fast Momentum Layer: A responsive EMA ribbon that
generates the actual entry trigger when it crosses in the direction confirmed
by the other layers
A signal only fires when all three layers agree. This triple
confluence approach filters out many false signals that occur in
single-indicator systems.
How It Works - The Core Mechanism
The indicator operates on a hierarchical confirmation
system:
-Macro Bias
The script pulls data from a configurable higher timeframe
(default: 4-hour) and calculates an EMA. When the current price is above this
higher-timeframe EMA, the macro bias is bullish and only long signals are
permitted. When price is below, the macro bias is bearish and only short
signals are allowed. An optional background color overlay (disabled by default
for a cleaner chart) can be enabled to provide immediate visual feedback on the
current macro state—white for bullish, black for bearish.
-Slow Trend and Fast Momentum (Dual EMA Ribbon System)
Two separate EMA ribbons are calculated on the current
timeframe:
-The Slow Trend ribbon uses longer-period EMAs (default: 16
and 30) and represents the intermediate trend. The area between these EMAs is
filled with color—green tones when the fast EMA is above the slow, red tones
when below.
-The Fast Momentum ribbon uses shorter-period EMAs
(default: 8 and 16) and captures momentum shifts. When the fast EMA of this
ribbon crosses above the slow EMA, it generates a potential long signal. A
cross below generates a potential short signal.
Signal Generation
A confirmed long entry requires:

-Macro Bias bullish (price > higher-timeframe EMA)
-Slow Trend bullish (16 EMA > 30 EMA)
-Fast Momentum crossover (8 EMA crosses above 16 EMA)
All active confluence filters passing (volume, ADX,
session, cooldown)
A confirmed short entry requires the inverse conditions
across all layers.
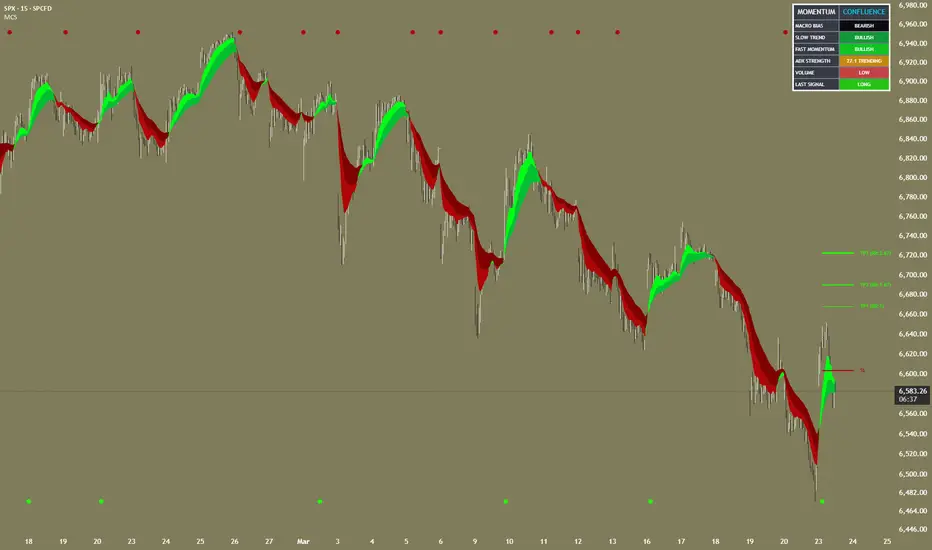
Signal Visualization
When a signal triggers, a small circle marker appears on the
chart:
-Long signals appear as tiny green circles at the very
bottom of the chart pane

-Short signals appear as tiny red circles at the very top
of the chart pane

This positioning ensures signals remain clearly visible
regardless of price action and do not overlap with candles or indicators.
-Confluence Filters - The Edge
Beyond the core triple-layer system, the indicator includes
several optional filters that add further confluence requirements:
-Volume Confirmation
When enabled, signals only trigger if the current bar's
volume exceeds a moving average of volume. This filters out signals occurring
during low-participation periods, where price moves are more likely to fail or
reverse. You can adjust the lookback period and require volume to be a multiple
above average (e.g., 1.2x means volume must be 20% above the average). This
filter is disabled by default to provide cleaner out-of-the-box signals—enable
it if you want additional volume-based confluence.

-ADX Trend Strength Filter
The Average Directional Index measures trend strength
regardless of direction. When enabled, signals only fire when ADX is above your
threshold (default: 20). ADX below 20 typically indicates a ranging or choppy
market where trend-following entries have lower probability. ADX above 25-30
indicates a strong trend where momentum strategies tend to perform well. This
filter is disabled by default to allow signals in all market conditions—enable
it to restrict signals to confirmed trending environments.
-RSI Divergence Confirmation
This optional filter looks for divergences between price and
RSI. For long signals, it checks whether price is making lower lows while RSI
makes higher lows (bullish divergence), suggesting downward momentum is
exhausting. For shorts, it looks for the opposite pattern. This adds a
mean-reversion element to the momentum-based system.
-Signal Cooldown
Prevents consecutive signals within a specified number of
bars. This serves two purposes: it prevents overtrading in volatile conditions,
and it ensures that once you enter a position, you have time for the trade to
develop before the system suggests another entry.
-Session Filter
Restricts signals to specific hours of the trading day.
Useful for focusing on high-liquidity sessions (such as the overlap between
London and New York for forex) or avoiding pre-market and after-hours periods
for stocks where spreads widen and false breakouts are more common.
Risk Management System
ATR-Based Stop Loss and Take Profit
The indicator calculates Average True Range and uses it to
set dynamic stop loss and take profit levels that adapt to current volatility.
In high-volatility conditions, stops and targets widen automatically to avoid
premature exits. In low-volatility conditions, they tighten to protect profits.
Multi-Target System
Rather than a single take profit level, the indicator
displays three targets:

-TP1 (default: 1.5x ATR) - Suggested for taking 50% of the
position off to lock in profit
-TP2 (default: 2.5x ATR) - Suggested for taking another 30%
and moving stop to breakeven
-TP3 (default: 4.0x ATR) - Runner target for the remaining
20%
Each target displays its risk-to-reward ratio on the chart,
helping you assess whether the trade setup meets your minimum RR requirements.
Trailing Stop Visualization
When enabled, displays a trailing stop line that follows
price by a configurable ATR distance. This is a visualization tool—you execute
the trailing stop manually or via your broker's platform.
Historical Signal Zones
The indicator can draw persistent boxes on the chart showing
the TP and SL zones from previous signals. This lets you review how past setups
played out relative to their projected targets, which is useful for refining
your settings.
Non-Repainting Architecture
The indicator includes a "Wait for Bar Close"
toggle that is enabled by default. When active, signals only fire after the
current bar has closed and all conditions are confirmed. This prevents signals
from appearing during bar formation and then disappearing—a phenomenon known as
repainting that can lead to false backtesting results.
For live trading, always keep this enabled. The only reason
to disable it is for visual exploration of real-time crossover detection during
chart study.
Dashboard Panel
A real-time information panel displays:
-Current macro bias state (bullish or bearish based on
higher timeframe)
-Slow trend state (direction of the intermediate EMA
ribbon)
-Fast momentum state (direction of the responsive EMA
ribbon)
ADX value and strength classification
(Weak/Trending/Strong)
Volume status relative to average (Low/Normal/High)
Last signal direction (Long/Short/None)
The dashboard provides all confluence conditions at a
glance, allowing you to quickly assess whether the market structure supports
your trading direction without scanning the chart.


Alert System
The following alerts can be configured:
-Long Entry Signal (fully filtered, confirmed signal)
-Short Entry Signal (fully filtered, confirmed signal)
-Any Entry Signal (either direction)
-Fast EMA Bullish Cross (unfiltered, for early awareness)
-Fast EMA Bearish Cross (unfiltered, for early awareness)
-Macro Trend Change (price crossing the higher-timeframe
EMA)
-ADX Entered Trending Zone
-ADX Exited Trending Zone
Alert messages include the ticker symbol, timeframe, and
price level for immediate context.
Recommended Settings by Style
-Day Trading (Primary Use Case - Default Settings)
-Macro Timeframe: 240 (4-hour)
-Fast Ribbon: 8/16
-Slow Ribbon: 16/30
-Volume Filter: Disabled by default (enable for additional
confluence)
-ADX Filter: Disabled by default (enable to filter ranging
markets)
Works across all liquid markets including forex majors,
indices, commodities, and large-cap stocks
Scalping Adaptation
Macro Timeframe: 60 (1-hour)
Fast Ribbon: 5/10
Slow Ribbon: 10/20
ADX Threshold: 25 (require stronger trend)
Cooldown: 3 bars
Best on high-liquidity pairs with tight spreads
Swing Trading Adaptation
Macro Timeframe: D (Daily)
Fast Ribbon: 10/21
Slow Ribbon: 21/50
ADX Threshold: 18
Cooldown: 10 bars
Session Filter: Disabled
What Makes This Indicator Unique
The value of this system lies not in any single
component—EMAs and ADX are well-established tools—but in how the components are
structured to work together as a coherent decision framework:
The hierarchical three-layer confirmation prevents the
common problem of entering trades against the prevailing trend
The confluence filters add further gates that signals must pass, reducing noise
The ATR-based risk management automatically adjusts to volatility
The multi-target system provides a complete trade
management framework rather than just entries
The dashboard consolidates state information that would
otherwise require multiple indicators
The non-repainting architecture ensures that what you see
in backtesting reflects actual live behavior
The combination creates a complete trading workflow in a
single indicator: trend identification, entry timing, position sizing guidance
(via RR ratios), and exit management.
Disclaimer
This indicator is a technical analysis tool, not financial
advice. No indicator can predict future price movement with certainty. Always
use proper risk management, never risk more than you can afford to lose, and
consider paper trading any new system before committing real capital. Past
performance of any trading system is not indicative of future results. The
indicator is suitable for all markets including forex, stocks, commodities,
indices, and cryptocurrencies. Performance will vary based on market conditions,
timeframe selection, and user-configured settings.
Fill Area Crossover concept originally developed by aballard11 The core visual
approach of using filled EMA ribbons to represent trend states was adapted and
significantly expanded with institutional-grade filtering, multi-layered
confluence logic, and professional risk management tools.
What This Indicator Does
The Momentum Confluence System is a multi-timeframe
trend-following indicator designed for day trading across all markets. It
identifies high-probability trade entries by requiring alignment across three
distinct layers of analysis before generating a signal:
-Macro Layer: A higher-timeframe directional filter that
determines whether the broader trend favors longs or shorts
-Slow Momentum Layer: An intermediate EMA ribbon that
confirms the underlying trend on the current timeframe
-Fast Momentum Layer: A responsive EMA ribbon that
generates the actual entry trigger when it crosses in the direction confirmed
by the other layers
A signal only fires when all three layers agree. This triple
confluence approach filters out many false signals that occur in
single-indicator systems.
How It Works - The Core Mechanism
The indicator operates on a hierarchical confirmation
system:
-Macro Bias
The script pulls data from a configurable higher timeframe
(default: 4-hour) and calculates an EMA. When the current price is above this
higher-timeframe EMA, the macro bias is bullish and only long signals are
permitted. When price is below, the macro bias is bearish and only short
signals are allowed. An optional background color overlay (disabled by default
for a cleaner chart) can be enabled to provide immediate visual feedback on the
current macro state—white for bullish, black for bearish.
-Slow Trend and Fast Momentum (Dual EMA Ribbon System)
Two separate EMA ribbons are calculated on the current
timeframe:
-The Slow Trend ribbon uses longer-period EMAs (default: 16
and 30) and represents the intermediate trend. The area between these EMAs is
filled with color—green tones when the fast EMA is above the slow, red tones
when below.
-The Fast Momentum ribbon uses shorter-period EMAs
(default: 8 and 16) and captures momentum shifts. When the fast EMA of this
ribbon crosses above the slow EMA, it generates a potential long signal. A
cross below generates a potential short signal.
Signal Generation
A confirmed long entry requires:
-Macro Bias bullish (price > higher-timeframe EMA)
-Slow Trend bullish (16 EMA > 30 EMA)
-Fast Momentum crossover (8 EMA crosses above 16 EMA)
All active confluence filters passing (volume, ADX,
session, cooldown)
A confirmed short entry requires the inverse conditions
across all layers.
Signal Visualization
When a signal triggers, a small circle marker appears on the
chart:
-Long signals appear as tiny green circles at the very
bottom of the chart pane
-Short signals appear as tiny red circles at the very top
of the chart pane
This positioning ensures signals remain clearly visible
regardless of price action and do not overlap with candles or indicators.
-Confluence Filters - The Edge
Beyond the core triple-layer system, the indicator includes
several optional filters that add further confluence requirements:
-Volume Confirmation
When enabled, signals only trigger if the current bar's
volume exceeds a moving average of volume. This filters out signals occurring
during low-participation periods, where price moves are more likely to fail or
reverse. You can adjust the lookback period and require volume to be a multiple
above average (e.g., 1.2x means volume must be 20% above the average). This
filter is disabled by default to provide cleaner out-of-the-box signals—enable
it if you want additional volume-based confluence.
-ADX Trend Strength Filter
The Average Directional Index measures trend strength
regardless of direction. When enabled, signals only fire when ADX is above your
threshold (default: 20). ADX below 20 typically indicates a ranging or choppy
market where trend-following entries have lower probability. ADX above 25-30
indicates a strong trend where momentum strategies tend to perform well. This
filter is disabled by default to allow signals in all market conditions—enable
it to restrict signals to confirmed trending environments.
-RSI Divergence Confirmation
This optional filter looks for divergences between price and
RSI. For long signals, it checks whether price is making lower lows while RSI
makes higher lows (bullish divergence), suggesting downward momentum is
exhausting. For shorts, it looks for the opposite pattern. This adds a
mean-reversion element to the momentum-based system.
-Signal Cooldown
Prevents consecutive signals within a specified number of
bars. This serves two purposes: it prevents overtrading in volatile conditions,
and it ensures that once you enter a position, you have time for the trade to
develop before the system suggests another entry.
-Session Filter
Restricts signals to specific hours of the trading day.
Useful for focusing on high-liquidity sessions (such as the overlap between
London and New York for forex) or avoiding pre-market and after-hours periods
for stocks where spreads widen and false breakouts are more common.
Risk Management System
ATR-Based Stop Loss and Take Profit
The indicator calculates Average True Range and uses it to
set dynamic stop loss and take profit levels that adapt to current volatility.
In high-volatility conditions, stops and targets widen automatically to avoid
premature exits. In low-volatility conditions, they tighten to protect profits.
Multi-Target System
Rather than a single take profit level, the indicator
displays three targets:
-TP1 (default: 1.5x ATR) - Suggested for taking 50% of the
position off to lock in profit
-TP2 (default: 2.5x ATR) - Suggested for taking another 30%
and moving stop to breakeven
-TP3 (default: 4.0x ATR) - Runner target for the remaining
20%
Each target displays its risk-to-reward ratio on the chart,
helping you assess whether the trade setup meets your minimum RR requirements.
Trailing Stop Visualization
When enabled, displays a trailing stop line that follows
price by a configurable ATR distance. This is a visualization tool—you execute
the trailing stop manually or via your broker's platform.
Historical Signal Zones
The indicator can draw persistent boxes on the chart showing
the TP and SL zones from previous signals. This lets you review how past setups
played out relative to their projected targets, which is useful for refining
your settings.
Non-Repainting Architecture
The indicator includes a "Wait for Bar Close"
toggle that is enabled by default. When active, signals only fire after the
current bar has closed and all conditions are confirmed. This prevents signals
from appearing during bar formation and then disappearing—a phenomenon known as
repainting that can lead to false backtesting results.
For live trading, always keep this enabled. The only reason
to disable it is for visual exploration of real-time crossover detection during
chart study.
Dashboard Panel
A real-time information panel displays:
-Current macro bias state (bullish or bearish based on
higher timeframe)
-Slow trend state (direction of the intermediate EMA
ribbon)
-Fast momentum state (direction of the responsive EMA
ribbon)
ADX value and strength classification
(Weak/Trending/Strong)
Volume status relative to average (Low/Normal/High)
Last signal direction (Long/Short/None)
The dashboard provides all confluence conditions at a
glance, allowing you to quickly assess whether the market structure supports
your trading direction without scanning the chart.
Alert System
The following alerts can be configured:
-Long Entry Signal (fully filtered, confirmed signal)
-Short Entry Signal (fully filtered, confirmed signal)
-Any Entry Signal (either direction)
-Fast EMA Bullish Cross (unfiltered, for early awareness)
-Fast EMA Bearish Cross (unfiltered, for early awareness)
-Macro Trend Change (price crossing the higher-timeframe
EMA)
-ADX Entered Trending Zone
-ADX Exited Trending Zone
Alert messages include the ticker symbol, timeframe, and
price level for immediate context.
Recommended Settings by Style
-Day Trading (Primary Use Case - Default Settings)
-Macro Timeframe: 240 (4-hour)
-Fast Ribbon: 8/16
-Slow Ribbon: 16/30
-Volume Filter: Disabled by default (enable for additional
confluence)
-ADX Filter: Disabled by default (enable to filter ranging
markets)
Works across all liquid markets including forex majors,
indices, commodities, and large-cap stocks
Scalping Adaptation
Macro Timeframe: 60 (1-hour)
Fast Ribbon: 5/10
Slow Ribbon: 10/20
ADX Threshold: 25 (require stronger trend)
Cooldown: 3 bars
Best on high-liquidity pairs with tight spreads
Swing Trading Adaptation
Macro Timeframe: D (Daily)
Fast Ribbon: 10/21
Slow Ribbon: 21/50
ADX Threshold: 18
Cooldown: 10 bars
Session Filter: Disabled
What Makes This Indicator Unique
The value of this system lies not in any single
component—EMAs and ADX are well-established tools—but in how the components are
structured to work together as a coherent decision framework:
The hierarchical three-layer confirmation prevents the
common problem of entering trades against the prevailing trend
The confluence filters add further gates that signals must pass, reducing noise
The ATR-based risk management automatically adjusts to volatility
The multi-target system provides a complete trade
management framework rather than just entries
The dashboard consolidates state information that would
otherwise require multiple indicators
The non-repainting architecture ensures that what you see
in backtesting reflects actual live behavior
The combination creates a complete trading workflow in a
single indicator: trend identification, entry timing, position sizing guidance
(via RR ratios), and exit management.
Disclaimer
This indicator is a technical analysis tool, not financial
advice. No indicator can predict future price movement with certainty. Always
use proper risk management, never risk more than you can afford to lose, and
consider paper trading any new system before committing real capital. Past
performance of any trading system is not indicative of future results. The
indicator is suitable for all markets including forex, stocks, commodities,
indices, and cryptocurrencies. Performance will vary based on market conditions,
timeframe selection, and user-configured settings.
نص برمجي مفتوح المصدر
بروح TradingView الحقيقية، قام مبتكر هذا النص البرمجي بجعله مفتوح المصدر، بحيث يمكن للمتداولين مراجعة وظائفه والتحقق منها. شكرا للمؤلف! بينما يمكنك استخدامه مجانًا، تذكر أن إعادة نشر الكود يخضع لقواعد الموقع الخاصة بنا.

إخلاء المسؤولية
لا يُقصد بالمعلومات والمنشورات أن تكون، أو تشكل، أي نصيحة مالية أو استثمارية أو تجارية أو أنواع أخرى من النصائح أو التوصيات المقدمة أو المعتمدة من TradingView. اقرأ المزيد في شروط الاستخدام.
نص برمجي مفتوح المصدر
بروح TradingView الحقيقية، قام مبتكر هذا النص البرمجي بجعله مفتوح المصدر، بحيث يمكن للمتداولين مراجعة وظائفه والتحقق منها. شكرا للمؤلف! بينما يمكنك استخدامه مجانًا، تذكر أن إعادة نشر الكود يخضع لقواعد الموقع الخاصة بنا.
إخلاء المسؤولية
لا يُقصد بالمعلومات والمنشورات أن تكون، أو تشكل، أي نصيحة مالية أو استثمارية أو تجارية أو أنواع أخرى من النصائح أو التوصيات المقدمة أو المعتمدة من TradingView. اقرأ المزيد في شروط الاستخدام.