MacD + Divergence
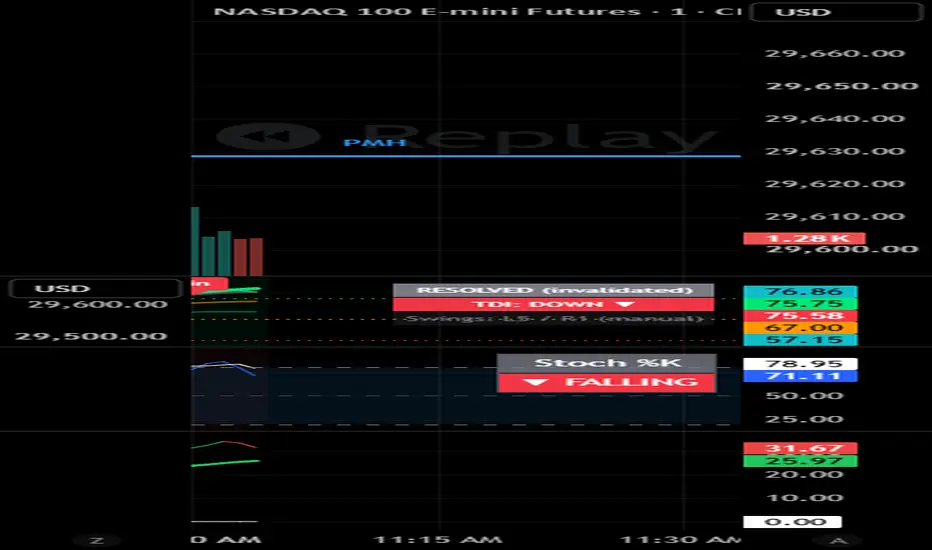
MACD + Divergence
MACD + Divergence is a momentum indicator built on the MACD. It shows short-term and long-term momentum together, numbers momentum waves, and marks divergence between price and momentum automatically. It was inspired by the momentum work of Dr. Barry Burns.
How it works
The indicator uses two momentum readings:
Fast momentum (MACD line): the 5 EMA minus the 20 EMA. It reacts quickly and is good for spotting early shifts.
Slow momentum (signal line): a 30 EMA of the MACD line. It’s slower and steadier, and its slope shows the overall direction of momentum.
The slow line isn’t used as a crossover signal. It’s a second momentum reading. The fast line often turns first and warns that the slow line, and the market, may turn next.
The standard MACD histogram (MACD minus signal) isn’t used. You can show the fast momentum line as a histogram instead.
Features
Slope coloring: each line turns one color when rising and another when falling. All colors can be changed.
Optional histogram: show the fast momentum line as columns, as a line, or both.
Color update mode: “Live” updates colors as the current bar forms. “On bar close” holds the color until the bar closes, so it never flickers.
Momentum wave counts: momentum swings are numbered in the current direction. Odd numbers are pushes and even numbers are pullbacks. Green counts are up-momentum and red counts are down-momentum. The count restarts when momentum makes its first higher high or lower low against the current direction.
Divergence detection on the fast momentum line:
– Regular bearish: price makes a higher high, momentum makes a lower high
– Regular bullish: price makes a lower low, momentum makes a higher low
– Strong bearish: price makes a higher high and a higher low, momentum makes a lower high and a lower low
– Strong bullish: price makes a lower low and a lower high, momentum makes a higher low and a higher high
– Hidden bullish and bearish divergence (continuation), off by default
Presets: 5/20/30 for charts in a 1:3 timeframe ratio, 3/10/15 for a 1:5 ratio such as daily and weekly, or your own custom lengths.
Zero line: when both momentum lines go flat near zero, there’s little momentum, which often means a choppy market.
Alerts: slow momentum turning up or down, fast momentum hooking up or down, new wave counts, and each type of divergence.
How to read it
Use the slope of the slow line for direction. Trading against it carries more risk unless the fast line is signaling a turn.
Watch the fast line for early warnings: hooks, divergence, and wave counts running long.
The strong divergence patterns are rarer than regular divergence but carry more weight.
Use it alongside trend, support and resistance, and your own entry rules. It isn’t meant to be used alone.
Notes
Wave counts and divergence are confirmed one bar after a momentum peak or trough, because momentum has to turn before the peak is known. In Live mode, colors and labels on the current bar can change until it closes.
This indicator is for educational purposes only and is not financial advice.
If you named any settings differently in your code, update those labels in the description to match.
MACD + Divergence is a momentum indicator built on the MACD. It shows short-term and long-term momentum together, numbers momentum waves, and marks divergence between price and momentum automatically. It was inspired by the momentum work of Dr. Barry Burns.
How it works
The indicator uses two momentum readings:
Fast momentum (MACD line): the 5 EMA minus the 20 EMA. It reacts quickly and is good for spotting early shifts.
Slow momentum (signal line): a 30 EMA of the MACD line. It’s slower and steadier, and its slope shows the overall direction of momentum.
The slow line isn’t used as a crossover signal. It’s a second momentum reading. The fast line often turns first and warns that the slow line, and the market, may turn next.
The standard MACD histogram (MACD minus signal) isn’t used. You can show the fast momentum line as a histogram instead.
Features
Slope coloring: each line turns one color when rising and another when falling. All colors can be changed.
Optional histogram: show the fast momentum line as columns, as a line, or both.
Color update mode: “Live” updates colors as the current bar forms. “On bar close” holds the color until the bar closes, so it never flickers.
Momentum wave counts: momentum swings are numbered in the current direction. Odd numbers are pushes and even numbers are pullbacks. Green counts are up-momentum and red counts are down-momentum. The count restarts when momentum makes its first higher high or lower low against the current direction.
Divergence detection on the fast momentum line:
– Regular bearish: price makes a higher high, momentum makes a lower high
– Regular bullish: price makes a lower low, momentum makes a higher low
– Strong bearish: price makes a higher high and a higher low, momentum makes a lower high and a lower low
– Strong bullish: price makes a lower low and a lower high, momentum makes a higher low and a higher high
– Hidden bullish and bearish divergence (continuation), off by default
Presets: 5/20/30 for charts in a 1:3 timeframe ratio, 3/10/15 for a 1:5 ratio such as daily and weekly, or your own custom lengths.
Zero line: when both momentum lines go flat near zero, there’s little momentum, which often means a choppy market.
Alerts: slow momentum turning up or down, fast momentum hooking up or down, new wave counts, and each type of divergence.
How to read it
Use the slope of the slow line for direction. Trading against it carries more risk unless the fast line is signaling a turn.
Watch the fast line for early warnings: hooks, divergence, and wave counts running long.
The strong divergence patterns are rarer than regular divergence but carry more weight.
Use it alongside trend, support and resistance, and your own entry rules. It isn’t meant to be used alone.
Notes
Wave counts and divergence are confirmed one bar after a momentum peak or trough, because momentum has to turn before the peak is known. In Live mode, colors and labels on the current bar can change until it closes.
This indicator is for educational purposes only and is not financial advice.
If you named any settings differently in your code, update those labels in the description to match.

إخلاء المسؤولية
لا يُقصد بالمعلومات والمنشورات أن تكون، أو تشكل، أي نصيحة مالية أو استثمارية أو تجارية أو أنواع أخرى من النصائح أو التوصيات المقدمة أو المعتمدة من TradingView. اقرأ المزيد في شروط الاستخدام.
إخلاء المسؤولية
لا يُقصد بالمعلومات والمنشورات أن تكون، أو تشكل، أي نصيحة مالية أو استثمارية أو تجارية أو أنواع أخرى من النصائح أو التوصيات المقدمة أو المعتمدة من TradingView. اقرأ المزيد في شروط الاستخدام.