OPEN-SOURCE SCRIPT
SMC ICT SESSIONS KILLZONES
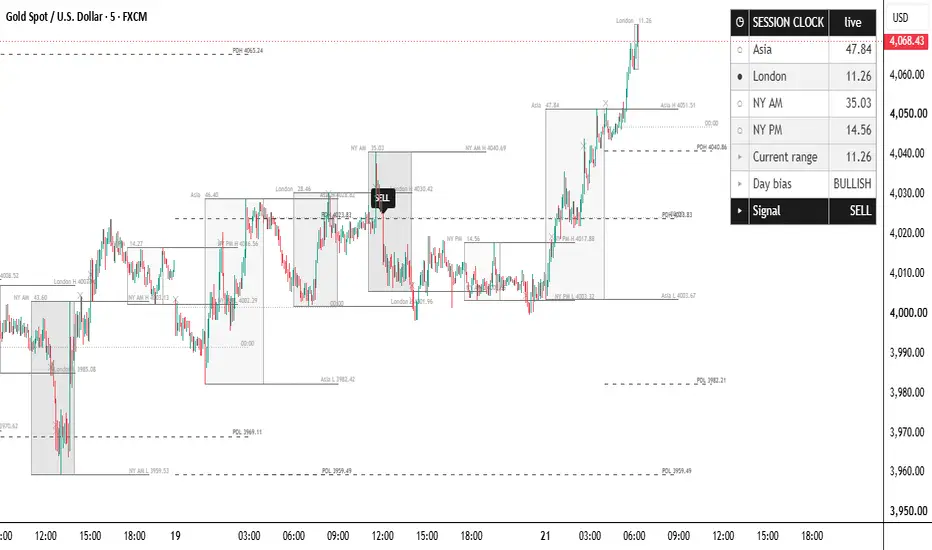
SMC ICT SESSIONS KILLZONES
tradingview.com/u/Michael_Fx_Trader/
Professional Smart Money Concepts (SMC) & ICT Session Analysis Indicator
SMC ICT SESSIONS KILLZONES is a professional TradingView indicator developed for traders who follow Smart Money Concepts (SMC) and ICT (Inner Circle Trader) trading methodology. The indicator automatically identifies the most important institutional trading sessions, highlights session liquidity ranges, tracks previous session highs and lows, detects liquidity sweeps, evaluates daily directional bias, and generates high-quality BUY/SELL confirmations based on Smart Money price behavior.
Instead of manually drawing session boxes, liquidity levels, previous day levels, and monitoring ICT Killzones throughout the trading day, this indicator performs the complete analysis automatically and presents the information in a clean institutional-style layout.
The objective of this indicator is to simplify ICT session analysis while preserving the core Smart Money concepts used by professional traders.
Why This Indicator Was Created
Institutional traders pay close attention to specific trading sessions because the majority of liquidity, volatility, and directional moves occur during these periods.
Many retail traders struggle to:
• Draw session boxes accurately every day.
• Track session highs and lows manually.
• Identify liquidity sweeps.
• Understand daily market bias.
• Recognize high probability ICT Killzone opportunities.
• Monitor Previous Day High (PDH) and Previous Day Low (PDL).
• Maintain a clean and organized trading chart.
SMC ICT SESSIONS KILLZONES was created to solve these problems by combining all essential ICT session tools into one professional indicator.
What This Indicator Does
The indicator automatically monitors every trading day and continuously performs institutional session analysis.
It identifies each major trading session, records its complete trading range, tracks session highs and lows, extends important liquidity levels forward, detects when those levels are swept by price, evaluates the current daily bias, and presents everything through a clean dashboard without requiring manual chart markup.
The indicator is designed to assist traders in understanding where institutional liquidity exists and how price reacts around those important areas.
Institutional Trading Sessions
The indicator automatically detects the four major ICT trading sessions.
Asia Session
The Asia Session establishes the initial liquidity range of the trading day.
The indicator automatically:
• Draws the complete session box.
• Records session high.
• Records session low.
• Calculates session range.
• Displays the completed range on the chart.
London Session
London is one of the highest volume trading sessions.
The indicator automatically tracks:
• London High
• London Low
• Session Range
• Liquidity Levels
• Session Box
New York AM Killzone
This session is one of the most important ICT trading periods.
The indicator automatically monitors:
• Opening volatility
• Institutional liquidity
• High and Low formation
• Session range
• Liquidity extension levels
New York PM Session
The afternoon session is also tracked automatically.
The indicator records:
• High
• Low
• Session Range
• Liquidity Levels
• Session Box
Session Boxes
Every completed session is displayed using clean institutional session boxes.
Each box clearly shows:
• Session beginning
• Session ending
• Session High
• Session Low
• Total Session Range
These visual session ranges allow traders to quickly identify where liquidity has formed during the day.
Session High & Low Liquidity Levels
After every session finishes, the indicator automatically extends the session High and Low forward into future price action.
These levels act as important liquidity references where price often reacts.
Every liquidity level is labeled clearly.
Examples include:
Asia High
Asia Low
London High
London Low
New York AM High
New York AM Low
New York PM High
New York PM Low
These levels remain visible to help traders monitor future liquidity interactions.
Previous Day High (PDH) & Previous Day Low (PDL)
The indicator automatically calculates:
• Previous Day High
• Previous Day Low
Both levels are displayed as extended dashed horizontal lines.
These institutional reference levels are widely used in ICT and Smart Money Concepts because they frequently become liquidity targets during the following trading day.
Midnight Open (00:00 Open)
The indicator also tracks the Midnight Open.
This level is commonly used within ICT methodology to determine daily directional bias.
The Midnight Open remains visible throughout the trading day and acts as an important reference point for evaluating bullish or bearish market conditions.
Liquidity Sweep Detection
One of the most valuable features of this indicator is automatic liquidity sweep detection.
Whenever price sweeps:
• Previous Session High
or
• Previous Session Low
the indicator immediately marks the event directly on the chart.
This allows traders to quickly identify potential Smart Money liquidity grabs before reversals or continuation moves occur.
BUY & SELL Confirmation Logic
The indicator includes Smart Money inspired BUY and SELL confirmations.
Signals are generated only after multiple conditions align.
For BUY confirmations, the indicator evaluates factors such as:
• Sell-side liquidity sweep
• Bullish reclaim
• Bullish price confirmation
• Daily bullish bias
For SELL confirmations, the indicator evaluates:
• Buy-side liquidity sweep
• Bearish rejection
• Bearish confirmation
• Daily bearish bias
The objective is to reduce unnecessary signals and focus only on higher quality opportunities based on institutional price behavior.
Daily Market Bias
Understanding directional bias is one of the most important parts of ICT trading.
The indicator continuously evaluates market conditions and classifies the day as:
• Bullish
• Bearish
• Neutral
This information helps traders align their execution with the prevailing market direction.
Session Dashboard
The professional Session Dashboard provides a complete overview of the trading day.
The dashboard includes:
• Current active session
• Live session status
• Individual session ranges
• Current trading range
• Daily bias
• Latest BUY or SELL signal
The dashboard is designed with a clean institutional appearance while occupying minimal chart space.
Monochrome Candle Mode
To improve chart readability, the indicator can optionally paint candles using a clean monochrome style.
Bullish candles appear brighter while bearish candles appear darker, allowing traders to focus more on price structure instead of excessive colors.
This feature can be enabled or disabled at any time.
Fully Customizable Settings
Every major component of the indicator can be customized.
Users can configure:
• Session Timezone
• Session Times
• Session Colors
• Dashboard Position
• Dashboard Size
• Session History
• Level Extension Distance
• Liquidity Levels
• Previous Day Levels
• Midnight Open
• Candle Coloring
• Session Boxes
• Dashboard Visibility
• BUY/SELL Signals
• Sweep Detection
This flexibility allows traders to adapt the indicator to their preferred trading style and market.
Best Timeframes
The indicator performs effectively across multiple timeframes.
Recommended usage includes:
• 1 Minute
• 3 Minute
• 5 Minute
• 15 Minute
• 30 Minute
• 1 Hour
It is particularly useful for intraday traders, ICT traders, Smart Money traders, scalpers, and session-based market participants.
Designed For
SMC Traders
ICT Traders
Liquidity Traders
Price Action Traders
Day Traders
Scalpers
Forex Traders
Indices Traders
Gold Traders
Crypto Traders
Institutional Style Market Analysis
How to Read the Indicator
Begin by identifying the current active session from the dashboard.
Observe the completed session boxes and understand where institutional liquidity has accumulated.
Watch the session High and Low extension levels for potential liquidity targets.
Monitor PDH, PDL, and Midnight Open to understand higher timeframe context.
When price sweeps an important liquidity level, observe whether the market rejects or reclaims that area.
Finally, combine the indicator's BUY or SELL confirmation with your own market structure, risk management, and execution strategy before entering a trade.
The indicator is intended to provide objective market context and institutional reference levels rather than act as a standalone automated trading system.
Author Verification & Original Implementation Declaration
Indicator Name: SMC ICT SESSIONS KILLZONES
Author: Michael_Fx_Trader
This TradingView indicator has been independently designed, engineered, and implemented by Michael_Fx_Trader.
The Pine Script implementation represents an original software development project created specifically for TradingView. Every calculation routine, session management system, dashboard component, visualization method, liquidity tracking process, session box architecture, market bias evaluation, alert structure, and overall script organization has been independently implemented by the author.
This indicator follows publicly known Smart Money Concepts (SMC) and ICT trading principles. These methodologies are widely used within the trading community and are not proprietary. However, the Pine Script source code, program structure, feature integration, optimization techniques, user interface, visualization logic, and implementation architecture contained in this indicator are the independent work of Michael_Fx_Trader.
The author verifies that this script was developed through an original implementation process and was engineered to provide a professional, efficient, and TradingView-ready institutional session analysis tool. No proprietary or protected source code from commercial indicators has been copied, reverse engineered, or redistributed as part of this implementation.
Original Implementation Verification
Michael_Fx_Trader hereby verifies that SMC ICT SESSIONS KILLZONES represents an independently developed Pine Script implementation created from the ground up for TradingView. All algorithms, calculations, session management routines, liquidity mapping, dashboard systems, visualization techniques, and feature integrations contained within this script reflect the author's own implementation approach and software engineering decisions.
Copyright © Michael_Fx_Trader. All Rights Reserved.
tradingview.com/u/Michael_Fx_Trader/
tradingview.com/u/Michael_Fx_Trader/
Professional Smart Money Concepts (SMC) & ICT Session Analysis Indicator
SMC ICT SESSIONS KILLZONES is a professional TradingView indicator developed for traders who follow Smart Money Concepts (SMC) and ICT (Inner Circle Trader) trading methodology. The indicator automatically identifies the most important institutional trading sessions, highlights session liquidity ranges, tracks previous session highs and lows, detects liquidity sweeps, evaluates daily directional bias, and generates high-quality BUY/SELL confirmations based on Smart Money price behavior.
Instead of manually drawing session boxes, liquidity levels, previous day levels, and monitoring ICT Killzones throughout the trading day, this indicator performs the complete analysis automatically and presents the information in a clean institutional-style layout.
The objective of this indicator is to simplify ICT session analysis while preserving the core Smart Money concepts used by professional traders.
Why This Indicator Was Created
Institutional traders pay close attention to specific trading sessions because the majority of liquidity, volatility, and directional moves occur during these periods.
Many retail traders struggle to:
• Draw session boxes accurately every day.
• Track session highs and lows manually.
• Identify liquidity sweeps.
• Understand daily market bias.
• Recognize high probability ICT Killzone opportunities.
• Monitor Previous Day High (PDH) and Previous Day Low (PDL).
• Maintain a clean and organized trading chart.
SMC ICT SESSIONS KILLZONES was created to solve these problems by combining all essential ICT session tools into one professional indicator.
What This Indicator Does
The indicator automatically monitors every trading day and continuously performs institutional session analysis.
It identifies each major trading session, records its complete trading range, tracks session highs and lows, extends important liquidity levels forward, detects when those levels are swept by price, evaluates the current daily bias, and presents everything through a clean dashboard without requiring manual chart markup.
The indicator is designed to assist traders in understanding where institutional liquidity exists and how price reacts around those important areas.
Institutional Trading Sessions
The indicator automatically detects the four major ICT trading sessions.
Asia Session
The Asia Session establishes the initial liquidity range of the trading day.
The indicator automatically:
• Draws the complete session box.
• Records session high.
• Records session low.
• Calculates session range.
• Displays the completed range on the chart.
London Session
London is one of the highest volume trading sessions.
The indicator automatically tracks:
• London High
• London Low
• Session Range
• Liquidity Levels
• Session Box
New York AM Killzone
This session is one of the most important ICT trading periods.
The indicator automatically monitors:
• Opening volatility
• Institutional liquidity
• High and Low formation
• Session range
• Liquidity extension levels
New York PM Session
The afternoon session is also tracked automatically.
The indicator records:
• High
• Low
• Session Range
• Liquidity Levels
• Session Box
Session Boxes
Every completed session is displayed using clean institutional session boxes.
Each box clearly shows:
• Session beginning
• Session ending
• Session High
• Session Low
• Total Session Range
These visual session ranges allow traders to quickly identify where liquidity has formed during the day.
Session High & Low Liquidity Levels
After every session finishes, the indicator automatically extends the session High and Low forward into future price action.
These levels act as important liquidity references where price often reacts.
Every liquidity level is labeled clearly.
Examples include:
Asia High
Asia Low
London High
London Low
New York AM High
New York AM Low
New York PM High
New York PM Low
These levels remain visible to help traders monitor future liquidity interactions.
Previous Day High (PDH) & Previous Day Low (PDL)
The indicator automatically calculates:
• Previous Day High
• Previous Day Low
Both levels are displayed as extended dashed horizontal lines.
These institutional reference levels are widely used in ICT and Smart Money Concepts because they frequently become liquidity targets during the following trading day.
Midnight Open (00:00 Open)
The indicator also tracks the Midnight Open.
This level is commonly used within ICT methodology to determine daily directional bias.
The Midnight Open remains visible throughout the trading day and acts as an important reference point for evaluating bullish or bearish market conditions.
Liquidity Sweep Detection
One of the most valuable features of this indicator is automatic liquidity sweep detection.
Whenever price sweeps:
• Previous Session High
or
• Previous Session Low
the indicator immediately marks the event directly on the chart.
This allows traders to quickly identify potential Smart Money liquidity grabs before reversals or continuation moves occur.
BUY & SELL Confirmation Logic
The indicator includes Smart Money inspired BUY and SELL confirmations.
Signals are generated only after multiple conditions align.
For BUY confirmations, the indicator evaluates factors such as:
• Sell-side liquidity sweep
• Bullish reclaim
• Bullish price confirmation
• Daily bullish bias
For SELL confirmations, the indicator evaluates:
• Buy-side liquidity sweep
• Bearish rejection
• Bearish confirmation
• Daily bearish bias
The objective is to reduce unnecessary signals and focus only on higher quality opportunities based on institutional price behavior.
Daily Market Bias
Understanding directional bias is one of the most important parts of ICT trading.
The indicator continuously evaluates market conditions and classifies the day as:
• Bullish
• Bearish
• Neutral
This information helps traders align their execution with the prevailing market direction.
Session Dashboard
The professional Session Dashboard provides a complete overview of the trading day.
The dashboard includes:
• Current active session
• Live session status
• Individual session ranges
• Current trading range
• Daily bias
• Latest BUY or SELL signal
The dashboard is designed with a clean institutional appearance while occupying minimal chart space.
Monochrome Candle Mode
To improve chart readability, the indicator can optionally paint candles using a clean monochrome style.
Bullish candles appear brighter while bearish candles appear darker, allowing traders to focus more on price structure instead of excessive colors.
This feature can be enabled or disabled at any time.
Fully Customizable Settings
Every major component of the indicator can be customized.
Users can configure:
• Session Timezone
• Session Times
• Session Colors
• Dashboard Position
• Dashboard Size
• Session History
• Level Extension Distance
• Liquidity Levels
• Previous Day Levels
• Midnight Open
• Candle Coloring
• Session Boxes
• Dashboard Visibility
• BUY/SELL Signals
• Sweep Detection
This flexibility allows traders to adapt the indicator to their preferred trading style and market.
Best Timeframes
The indicator performs effectively across multiple timeframes.
Recommended usage includes:
• 1 Minute
• 3 Minute
• 5 Minute
• 15 Minute
• 30 Minute
• 1 Hour
It is particularly useful for intraday traders, ICT traders, Smart Money traders, scalpers, and session-based market participants.
Designed For
SMC Traders
ICT Traders
Liquidity Traders
Price Action Traders
Day Traders
Scalpers
Forex Traders
Indices Traders
Gold Traders
Crypto Traders
Institutional Style Market Analysis
How to Read the Indicator
Begin by identifying the current active session from the dashboard.
Observe the completed session boxes and understand where institutional liquidity has accumulated.
Watch the session High and Low extension levels for potential liquidity targets.
Monitor PDH, PDL, and Midnight Open to understand higher timeframe context.
When price sweeps an important liquidity level, observe whether the market rejects or reclaims that area.
Finally, combine the indicator's BUY or SELL confirmation with your own market structure, risk management, and execution strategy before entering a trade.
The indicator is intended to provide objective market context and institutional reference levels rather than act as a standalone automated trading system.
Author Verification & Original Implementation Declaration
Indicator Name: SMC ICT SESSIONS KILLZONES
Author: Michael_Fx_Trader
This TradingView indicator has been independently designed, engineered, and implemented by Michael_Fx_Trader.
The Pine Script implementation represents an original software development project created specifically for TradingView. Every calculation routine, session management system, dashboard component, visualization method, liquidity tracking process, session box architecture, market bias evaluation, alert structure, and overall script organization has been independently implemented by the author.
This indicator follows publicly known Smart Money Concepts (SMC) and ICT trading principles. These methodologies are widely used within the trading community and are not proprietary. However, the Pine Script source code, program structure, feature integration, optimization techniques, user interface, visualization logic, and implementation architecture contained in this indicator are the independent work of Michael_Fx_Trader.
The author verifies that this script was developed through an original implementation process and was engineered to provide a professional, efficient, and TradingView-ready institutional session analysis tool. No proprietary or protected source code from commercial indicators has been copied, reverse engineered, or redistributed as part of this implementation.
Original Implementation Verification
Michael_Fx_Trader hereby verifies that SMC ICT SESSIONS KILLZONES represents an independently developed Pine Script implementation created from the ground up for TradingView. All algorithms, calculations, session management routines, liquidity mapping, dashboard systems, visualization techniques, and feature integrations contained within this script reflect the author's own implementation approach and software engineering decisions.
Copyright © Michael_Fx_Trader. All Rights Reserved.
tradingview.com/u/Michael_Fx_Trader/
نص برمجي مفتوح المصدر
بروح TradingView الحقيقية، قام مبتكر هذا النص البرمجي بجعله مفتوح المصدر، بحيث يمكن للمتداولين مراجعة وظائفه والتحقق منها. شكرا للمؤلف! بينما يمكنك استخدامه مجانًا، تذكر أن إعادة نشر الكود يخضع لقواعد الموقع الخاصة بنا.

Join My VIP Free Signals Channel.✅
telegram.me/+T9gVIx9iZXcwN2Y1
For Daily LIVE Trades,
Join Free Telegram Channel ✅
telegram.me/+T9gVIx9iZXcwN2Y1
telegram.me/+T9gVIx9iZXcwN2Y1
For Daily LIVE Trades,
Join Free Telegram Channel ✅
telegram.me/+T9gVIx9iZXcwN2Y1
إخلاء المسؤولية
لا يُقصد بالمعلومات والمنشورات أن تكون، أو تشكل، أي نصيحة مالية أو استثمارية أو تجارية أو أنواع أخرى من النصائح أو التوصيات المقدمة أو المعتمدة من TradingView. اقرأ المزيد في شروط الاستخدام.
نص برمجي مفتوح المصدر
بروح TradingView الحقيقية، قام مبتكر هذا النص البرمجي بجعله مفتوح المصدر، بحيث يمكن للمتداولين مراجعة وظائفه والتحقق منها. شكرا للمؤلف! بينما يمكنك استخدامه مجانًا، تذكر أن إعادة نشر الكود يخضع لقواعد الموقع الخاصة بنا.
Join My VIP Free Signals Channel.✅
telegram.me/+T9gVIx9iZXcwN2Y1
For Daily LIVE Trades,
Join Free Telegram Channel ✅
telegram.me/+T9gVIx9iZXcwN2Y1
telegram.me/+T9gVIx9iZXcwN2Y1
For Daily LIVE Trades,
Join Free Telegram Channel ✅
telegram.me/+T9gVIx9iZXcwN2Y1
إخلاء المسؤولية
لا يُقصد بالمعلومات والمنشورات أن تكون، أو تشكل، أي نصيحة مالية أو استثمارية أو تجارية أو أنواع أخرى من النصائح أو التوصيات المقدمة أو المعتمدة من TradingView. اقرأ المزيد في شروط الاستخدام.