Daily High/Low probability zones
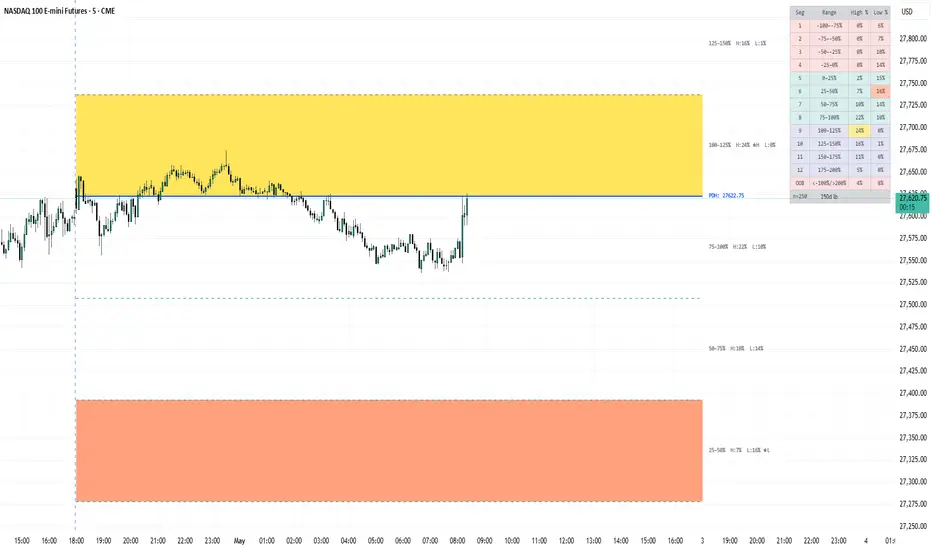
Daily High/Low probability zones
Overview
Daily Segment Probabilities analyses the statistical distribution of where a market forms its daily High and daily Low relative to the previous session's range. By studying the prior day's High (PDH) and Low (PDL) across a user-defined lookback window, the indicator divides the price space around that range into 12 equal segments of 25% each — from −100% to +200% — and calculates how frequently the current session's High and Low have historically landed inside each segment. The result is a probability map drawn directly on the chart for today's session, letting you see at a glance which zones have historically attracted the day's extremes.
What is shown on the chart
The PDH and PDL of the prior session are drawn as solid horizontal lines across the current day, labelled in the margin. These form the 0% and 100% anchor points of the range.
Twelve segment boundaries are then projected from PDL upward and downward using the prior day's range as the measuring unit. Each boundary is coloured by zone: teal for the inside range (0–100%), indigo for upside extensions (above 100%), and red for downside extensions (below 0%). The 0% and 100% lines themselves are omitted from the segment boundaries since the PDH/PDL lines already mark them.
At the midpoint of each band, a label shows the segment name alongside the historical probability of the day's High and Low forming within that band — for example 0–25% H:18% L:34%. A tooltip on each label gives the full count of occurrences out of total sample days.
The two highest-probability bands are highlighted with a filled overlay: a gold fill marks the segment where the day's High has most frequently formed, and an orange fill marks the segment where the day's Low has most frequently formed. These fills are also reflected in the probability table — the High% and Low% cells for the top segments are coloured to match, creating a direct visual link between the chart and the table. Labels for the top bands carry a ★H or ★L marker for quick identification.
The probability table
The table summarises the full segment distribution in a compact grid with four columns:
Seg — segment number (1–12, top to bottom of chart)
Range — the percentage band that segment covers
High% — percentage of historical days where the session High formed in this segment
Low% — percentage of historical days where the session Low formed in this segment
Below the twelve data rows is an OOB (out-of-bounds) row counting days where the High or Low fell completely outside the −100% to +200% window. The footer row shows the actual sample size (n) and the configured lookback.
The High% and Low% cells for the two top-probability segments are highlighted with the same fill colours used on the chart, so the table and the chart read as a unified system.
How the lookback and calculation work
The lookback setting (default 250 days, range 10–500) defines how many prior daily sessions are included in the historical sample.
For each day in that window the indicator:
Takes the prior session's High and Low to establish the reference range and its 0% / 100% anchors.
Measures where that session's own High and Low fell, expressed as a percentage of the prior range above the prior Low — so a High exactly at the PDH of its own prior session registers as 100%, and a Low exactly at the PDL registers as 0%.
Assigns each reading to whichever 25%-wide segment it falls into.
Counts occurrences per segment across all n valid days (days where the prior range is greater than zero are included; zero-range days are skipped).
Probabilities in the table and labels are the count for each segment divided by n, rounded to the nearest whole percent. The top-segment fills and ★ markers are determined purely by the highest raw count, not the rounded percentage, so ties resolve correctly.
A minimum of 5 valid days is required before anything is drawn.
Settings
Core Settings
Lookback (days) — number of prior sessions used to build the probability distribution. Higher values give a more statistically stable sample; lower values are more responsive to recent market character. 250 days (roughly one trading year) is a reasonable default for most instruments.
Visual Settings
PDH/PDL line colour — colour of the prior day High and Low anchor lines.
Inside range colour (0–100%) — colour applied to segment boundaries within the prior range.
Extension above colour (>100%) — colour for boundaries above the PDH.
Extension below colour (<0%) — colour for boundaries below the PDL.
Label text colour — colour of the midpoint probability labels.
Segment line style — Solid, Dotted, or Dashed for segment boundaries.
PDH/PDL line style — Solid, Dotted, or Dashed for the anchor lines.
Top High% band fill colour — fill colour for the highest-probability High segment (default gold).
Top Low% band fill colour — fill colour for the highest-probability Low segment (default orange).
Table Settings
Show probability table — toggle the table on or off.
Table position — Top Right, Bottom Right, Middle Right, Bottom Center, or Middle Left.
Table text size — Auto, Tiny, Small, Normal, Large, or Huge.
Interpreting the output
The indicator does not predict where price will go — it describes where it has historically gone. A segment showing H:35% means the day's High landed in that band on roughly one in three days over the lookback period. Used alongside other context (session opens, market structure, news), the distribution can inform expectations for the day's likely trading range and where extension targets have historically clustered.
Segments inside the prior range (0–100%) capturing a high proportion of Low readings suggest mean-reversion sessions are common for the instrument. Large probabilities in extension segments (above 100% or below 0%) reflect trending or breakout tendencies. The OOB row is worth watching on highly volatile instruments where extreme moves regularly exceed the prior range by a wide margin.
Notes
The indicator is drawn only on the last bar of the chart to avoid repainting and to keep line/label counts within TradingView's limits.
It is designed for use on intraday timeframes (1m–1h) where the daily session boundaries are visible. On a daily chart it will still compile but the lines will span only the current day's single candle.
The prior session data is fetched via request.security on the daily timeframe with lookahead_off to prevent look-ahead bias.
All percentages shown are based on historical frequency only and carry no implied forward guarantee.
Overview
Daily Segment Probabilities analyses the statistical distribution of where a market forms its daily High and daily Low relative to the previous session's range. By studying the prior day's High (PDH) and Low (PDL) across a user-defined lookback window, the indicator divides the price space around that range into 12 equal segments of 25% each — from −100% to +200% — and calculates how frequently the current session's High and Low have historically landed inside each segment. The result is a probability map drawn directly on the chart for today's session, letting you see at a glance which zones have historically attracted the day's extremes.
What is shown on the chart
The PDH and PDL of the prior session are drawn as solid horizontal lines across the current day, labelled in the margin. These form the 0% and 100% anchor points of the range.
Twelve segment boundaries are then projected from PDL upward and downward using the prior day's range as the measuring unit. Each boundary is coloured by zone: teal for the inside range (0–100%), indigo for upside extensions (above 100%), and red for downside extensions (below 0%). The 0% and 100% lines themselves are omitted from the segment boundaries since the PDH/PDL lines already mark them.
At the midpoint of each band, a label shows the segment name alongside the historical probability of the day's High and Low forming within that band — for example 0–25% H:18% L:34%. A tooltip on each label gives the full count of occurrences out of total sample days.
The two highest-probability bands are highlighted with a filled overlay: a gold fill marks the segment where the day's High has most frequently formed, and an orange fill marks the segment where the day's Low has most frequently formed. These fills are also reflected in the probability table — the High% and Low% cells for the top segments are coloured to match, creating a direct visual link between the chart and the table. Labels for the top bands carry a ★H or ★L marker for quick identification.
The probability table
The table summarises the full segment distribution in a compact grid with four columns:
Seg — segment number (1–12, top to bottom of chart)
Range — the percentage band that segment covers
High% — percentage of historical days where the session High formed in this segment
Low% — percentage of historical days where the session Low formed in this segment
Below the twelve data rows is an OOB (out-of-bounds) row counting days where the High or Low fell completely outside the −100% to +200% window. The footer row shows the actual sample size (n) and the configured lookback.
The High% and Low% cells for the two top-probability segments are highlighted with the same fill colours used on the chart, so the table and the chart read as a unified system.
How the lookback and calculation work
The lookback setting (default 250 days, range 10–500) defines how many prior daily sessions are included in the historical sample.
For each day in that window the indicator:
Takes the prior session's High and Low to establish the reference range and its 0% / 100% anchors.
Measures where that session's own High and Low fell, expressed as a percentage of the prior range above the prior Low — so a High exactly at the PDH of its own prior session registers as 100%, and a Low exactly at the PDL registers as 0%.
Assigns each reading to whichever 25%-wide segment it falls into.
Counts occurrences per segment across all n valid days (days where the prior range is greater than zero are included; zero-range days are skipped).
Probabilities in the table and labels are the count for each segment divided by n, rounded to the nearest whole percent. The top-segment fills and ★ markers are determined purely by the highest raw count, not the rounded percentage, so ties resolve correctly.
A minimum of 5 valid days is required before anything is drawn.
Settings
Core Settings
Lookback (days) — number of prior sessions used to build the probability distribution. Higher values give a more statistically stable sample; lower values are more responsive to recent market character. 250 days (roughly one trading year) is a reasonable default for most instruments.
Visual Settings
PDH/PDL line colour — colour of the prior day High and Low anchor lines.
Inside range colour (0–100%) — colour applied to segment boundaries within the prior range.
Extension above colour (>100%) — colour for boundaries above the PDH.
Extension below colour (<0%) — colour for boundaries below the PDL.
Label text colour — colour of the midpoint probability labels.
Segment line style — Solid, Dotted, or Dashed for segment boundaries.
PDH/PDL line style — Solid, Dotted, or Dashed for the anchor lines.
Top High% band fill colour — fill colour for the highest-probability High segment (default gold).
Top Low% band fill colour — fill colour for the highest-probability Low segment (default orange).
Table Settings
Show probability table — toggle the table on or off.
Table position — Top Right, Bottom Right, Middle Right, Bottom Center, or Middle Left.
Table text size — Auto, Tiny, Small, Normal, Large, or Huge.
Interpreting the output
The indicator does not predict where price will go — it describes where it has historically gone. A segment showing H:35% means the day's High landed in that band on roughly one in three days over the lookback period. Used alongside other context (session opens, market structure, news), the distribution can inform expectations for the day's likely trading range and where extension targets have historically clustered.
Segments inside the prior range (0–100%) capturing a high proportion of Low readings suggest mean-reversion sessions are common for the instrument. Large probabilities in extension segments (above 100% or below 0%) reflect trending or breakout tendencies. The OOB row is worth watching on highly volatile instruments where extreme moves regularly exceed the prior range by a wide margin.
Notes
The indicator is drawn only on the last bar of the chart to avoid repainting and to keep line/label counts within TradingView's limits.
It is designed for use on intraday timeframes (1m–1h) where the daily session boundaries are visible. On a daily chart it will still compile but the lines will span only the current day's single candle.
The prior session data is fetched via request.security on the daily timeframe with lookahead_off to prevent look-ahead bias.
All percentages shown are based on historical frequency only and carry no implied forward guarantee.

إخلاء المسؤولية
لا يُقصد بالمعلومات والمنشورات أن تكون، أو تشكل، أي نصيحة مالية أو استثمارية أو تجارية أو أنواع أخرى من النصائح أو التوصيات المقدمة أو المعتمدة من TradingView. اقرأ المزيد في شروط الاستخدام.
إخلاء المسؤولية
لا يُقصد بالمعلومات والمنشورات أن تكون، أو تشكل، أي نصيحة مالية أو استثمارية أو تجارية أو أنواع أخرى من النصائح أو التوصيات المقدمة أو المعتمدة من TradingView. اقرأ المزيد في شروط الاستخدام.