OPEN-SOURCE SCRIPT
تم تحديثه Weekly Stochastic
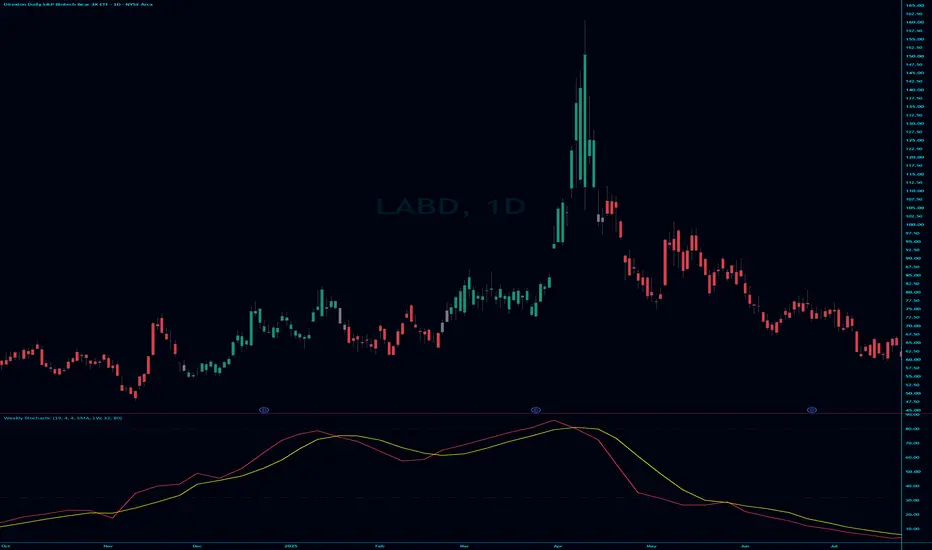
Color of candles depended on the trend. when K crosses over candles are green. when k crosses under candles are red
ملاحظات الأخبار
**Weekly Stochastic Trend Tracker**This indicator is designed to identify and highlight major macro trends by using a custom Weekly Stochastic oscillator (19, 4, 4) overlaid onto your current chart. It filters out market noise by applying a strict 4-step state machine to color your candles, ensuring you only see trend signals when momentum is fully confirmed.
**How it Works:**
The indicator calculates a Weekly Stochastic and colors the chart candles based on the following cycle:
* **Gray (Neutral/Shift):** Occurs immediately when the Stochastic `%K` crosses over or under `%D`, signaling a potential momentum shift.
* **Green (Confirmed Uptrend):** After a bullish cross, if `%K` holds above the 32 level for 3 consecutive bars, the candles turn Green to signal a strong uptrend.
* **Red (Confirmed Downtrend):** After a bearish cross, if `%K` stays below 80 and below `%D` for 3 consecutive bars, the candles turn Red to signal a strong downtrend.
**Features:**
* **Multi-Timeframe (MTF):** Operates on weekly data regardless of your chart's timeframe.
* **Non-Repainting Logic:** By default, it waits for the weekly candle to close before locking in signals.
* **Visual Smoothing:** Includes an interpolation toggle to display smooth, straight lines connecting the weekly data points instead of jagged steps on lower timeframes.
* **Custom Smoothing Types:** Allows you to change the Stochastic smoothing calculation (SMA, EMA, WMA, RMA) to fit your preference.
This tool is ideal for swing traders and trend followers looking to stay on the right side of the weekly momentum.
ملاحظات الأخبار
I fixed a couple bugs with the grey barsنص برمجي مفتوح المصدر
بروح TradingView الحقيقية، قام مبتكر هذا النص البرمجي بجعله مفتوح المصدر، بحيث يمكن للمتداولين مراجعة وظائفه والتحقق منها. شكرا للمؤلف! بينما يمكنك استخدامه مجانًا، تذكر أن إعادة نشر الكود يخضع لقواعد الموقع الخاصة بنا.

إخلاء المسؤولية
لا يُقصد بالمعلومات والمنشورات أن تكون، أو تشكل، أي نصيحة مالية أو استثمارية أو تجارية أو أنواع أخرى من النصائح أو التوصيات المقدمة أو المعتمدة من TradingView. اقرأ المزيد في شروط الاستخدام.
نص برمجي مفتوح المصدر
بروح TradingView الحقيقية، قام مبتكر هذا النص البرمجي بجعله مفتوح المصدر، بحيث يمكن للمتداولين مراجعة وظائفه والتحقق منها. شكرا للمؤلف! بينما يمكنك استخدامه مجانًا، تذكر أن إعادة نشر الكود يخضع لقواعد الموقع الخاصة بنا.
إخلاء المسؤولية
لا يُقصد بالمعلومات والمنشورات أن تكون، أو تشكل، أي نصيحة مالية أو استثمارية أو تجارية أو أنواع أخرى من النصائح أو التوصيات المقدمة أو المعتمدة من TradingView. اقرأ المزيد في شروط الاستخدام.