OPEN-SOURCE SCRIPT
MTF Supply & Demand Zones [ZeroEmotionTrading]
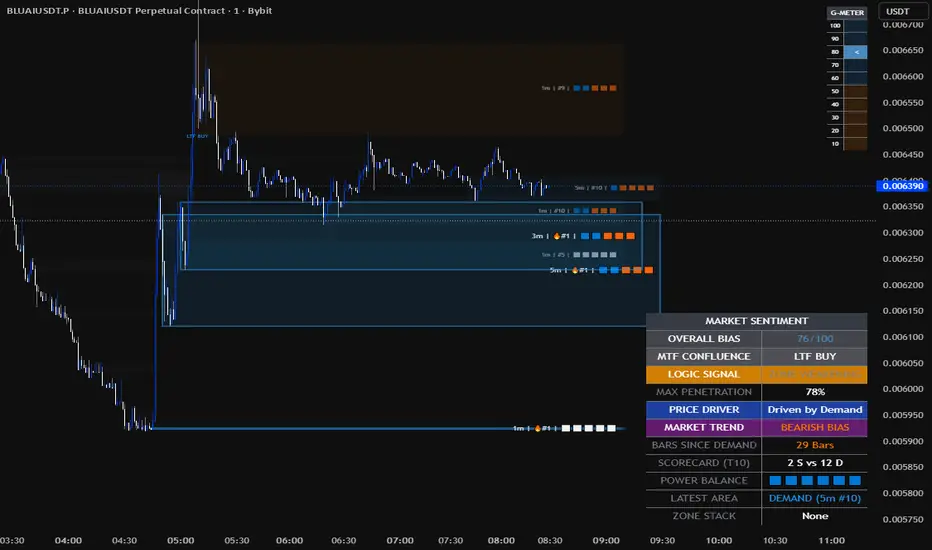
**MTF Supply & Demand Zones [ZeroEmotionTrading]** is a multi-timeframe market structure tool that maps where aggressive buying and selling has historically entered the market, then ranks those zones by strength, tracks how price interacts with them in real time, and converts that information into a tactical dashboard for trade decision-making.
Instead of showing a single support or resistance level, this indicator builds a full **multi-timeframe supply/demand map**, scores the importance of each active zone, measures whether buyers or sellers are winning the battle inside those zones, and helps identify whether price is more likely to **bounce, continue, weaken, or break through**.
It is designed to answer three questions quickly:
1. **Who is in control right now?**
2. **Is the current floor/ceiling strong or failing?**
3. **Is there enough confluence to justify a trade?**
---
## Detailed Explanation of Features
### 1) Multi-Timeframe Supply & Demand Zones
The core of the indicator is the zone engine.
* **Blue Zones = Demand**
Areas where strong buying previously entered the market. Think of these as potential floors.
* **Orange Zones = Supply**
Areas where strong selling previously entered the market. Think of these as potential ceilings.
The indicator monitors multiple timeframes at once so you can see:
* local reaction zones
* lower timeframe scalp zones
* higher timeframe structural zones
This helps separate weak intraday levels from meaningful macro areas.
---
### 2) Zone Ranking System
Each active zone is ranked by relative strength.
* **#1 zones** are the strongest and most important active zones
* lower-ranked zones provide context and secondary reaction areas
* muted “ghost” zones help visualize broader structure without overpowering the chart
A high-rank zone matters more than a low-rank zone, especially when price is approaching it for the first time.
---
### 3) Zone Labels and Battle Bars
Each zone label shows:
**[Timeframe] | [Rank] | [Battle Bar]**
The battle bar is one of the most important parts of the system because it shows what is happening **inside the zone after creation**.
* **White blocks** = virgin zone
Price has not meaningfully interacted with it since creation. These are often the cleanest reaction zones.
* **Blue blocks** = buying pressure inside the zone
* **Orange blocks** = selling pressure inside the zone
This lets you read whether a zone is still healthy or under attack.
Examples:
* A **blue demand zone filling with orange blocks** means sellers are pressing into the floor
* An **orange supply zone filling with blue blocks** means buyers are leaning on the ceiling
* A heavily imbalanced battle bar often warns that a zone may fail soon
---
### 4) Dashboard / Tactical Console
The dashboard turns raw zone data into a real-time market read.
#### Overall Bias
A 0–100 weighted bias meter showing bullish vs bearish confluence from all active zones.
* **Higher values** favor bullish conditions
* **Lower values** favor bearish conditions
* It is proximity-weighted, so zones close to price matter more than zones far away
This is your broad “which side has the edge” read.
---
#### Logic Signal
This tells you the current condition of the market structure.
Common states include:
* **Stable**
Current structure is intact and there is no immediate warning
* **Zone Weakening**
Price is pushing deep into a zone and the level is losing integrity
* **Barrier Critical**
Price is near or beyond the critical break point of the current floor/ceiling
* **Vacuum Creep**
Price is drifting without fresh structural creation and may move inefficiently until it finds the next major zone
This is one of the best ways to know whether you should trust a level or expect failure.
---
#### Max Penetration
Shows how deeply price has pushed into a zone.
* low penetration usually means the level is reacting cleanly
* high penetration means the zone is being stress-tested
* extreme penetration often warns of likely breakdown or breakout
This is critical for avoiding “buying a floor that is already failing” or “shorting a ceiling that is already being absorbed.”
---
#### Price Driver
Identifies the immediate force affecting price.
Examples:
* **Driven by Demand**
* **Driven by Supply**
* **Scanning Market** when no clear driver is dominant
This is the short-term controller and helps with timing entries and understanding whether price is reacting to a live floor or ceiling.
---
#### Market Trend / Regime
This gives the broader condition of the tape.
Examples may include:
* bullish bias
* bearish bias
* bullish breakout
* sideways
* choppy
This helps distinguish between:
* clean directional conditions
* breakout conditions
* messy/noisy environments where selectivity matters more
---
#### Bars Since Demand / Structural Recency
Shows how long it has been since a new meaningful zone event occurred.
This helps identify whether the market is:
* still being supported by fresh structure
* or drifting away from recent zone formation
---
#### Scorecard
A fast summary of bullish vs bearish zone influence.
This is useful for quickly checking whether the market currently favors:
* demand-led structure
* supply-led structure
* or mixed conditions
---
#### Power Balance
A visual barometer of aggregated zone pressure.
This gives you a quick read on whether active market structure is dominated by buyers or sellers.
---
#### Latest Area
Displays the most relevant newly active zone around current price.
This is useful for understanding what the market is currently reacting to.
---
#### Zone Stack
Shows when multiple timeframes overlap in the same area.
This is extremely important.
A stack means:
* multiple zones from different timeframes are aligned in the same region
* the level usually carries more weight
* the reaction potential is often stronger than a single isolated zone
Stacked zones are some of the highest-quality areas on the chart.
---
### 5) Lower Dashboard / Per-Timeframe Readout
The lower left panel breaks down the individual timeframe state.
Depending on your version, it may include metrics such as:
* EMA alignment
* structural confirmation
* volume delta / VIDYA-based bias
* volume transition
* volume strength
This is where you can see whether lower timeframes and higher timeframes are aligned or diverging.
When several rows point in the same direction, trade quality improves.
---
### 6) Entry / Rejection Markers
The system can also display trade triggers or reaction markers when price interacts with zones.
Typical use:
* bullish confirmation when demand holds
* bearish confirmation when supply rejects
* optional management / exit-style prompts depending on your settings
These markers are not meant to replace context. They work best when aligned with the dashboard and zone structure.
---
## How to Trade the Indicator
The indicator is built around three core trade ideas.
---
### Play A: High-Confluence Reversal
This is the classic reversal off a strong floor or ceiling.
#### Long example
* price drops into a **stacked demand area**
* dashboard bias improves
* price driver shifts toward demand
* battle bar shows the zone is not being overwhelmed
* bullish confirmation appears
Entry:
* on the rejection candle close or confirmation marker
Stop:
* below the structural low of the stacked demand area
Target:
* nearest opposing supply
* then higher timeframe supply if momentum continues
#### Short example
Same logic in reverse at stacked supply.
Best use:
* when a major floor/ceiling is being defended
* when there is visible multi-timeframe confluence
---
### Play B: Trend Continuation Pullback
This is the bread-and-butter continuation trade.
#### Bullish continuation
* overall bias is bullish
* demand is dominant on the scorecard / power balance
* price pulls back into a fresh or lightly tested blue zone
* rejection confirms the level
Entry:
* on the bounce / confirmation candle close
Stop:
* below the supporting demand zone
Target:
* retest of recent highs
* then the next supply zone above
#### Bearish continuation
Reverse the process:
* bearish bias
* supply in control
* price pulls back into orange
* rejection confirms
This play works best when trading **with** the dominant structure instead of fading it.
---
### Play C: Zone Failure / Breakout
This is the “do not fade the level” setup.
Use this when:
* logic shifts to **Barrier Critical**
* max penetration is high
* battle bars show the defending side is losing
* price closes through the level with acceptance
#### Bullish breakout
* supply is absorbed
* price accepts above the ceiling
* old supply can become support on retest
#### Bearish breakdown
* demand is overrun
* price closes below the floor
* old demand can become resistance on retest
The key is not just the break itself, but whether price **accepts** beyond the zone.
---
## Practical Trading Workflow
A simple process for reading the indicator:
### Step 1: Identify the Controller
Check:
* Overall Bias
* Price Driver
* Power Balance
* Market Trend
This tells you whether the market is currently demand-led, supply-led, or mixed.
---
### Step 2: Evaluate the Zone
Before taking any entry, ask:
* is the zone virgin or already heavily tested?
* is it high-rank or low-rank?
* is it stacked with other timeframes?
* is it being defended or attacked?
Not all zones are equal.
---
### Step 3: Check Penetration
A clean reaction is very different from a zone that is already nearly broken.
* shallow penetration = healthier reaction
* deep penetration = caution
* extreme penetration = prepare for failure / breakout conditions
---
### Step 4: Wait for Confirmation
The highest-probability setups happen when:
* the dashboard agrees
* the zone quality is strong
* the controller is aligned
* a rejection / continuation trigger appears
This keeps you from trading every touch blindly.
---
### Step 5: Manage the Trade by Structure
For longs:
* stay valid while price holds above demand
* reduce if price loses the zone cleanly
For shorts:
* stay valid while price remains capped below supply
* reduce if price reclaims the zone with acceptance
Targets are usually:
* first opposing zone
* then the next higher-timeframe zone if momentum continues
---
## Best Use Cases
This indicator is best suited for traders who want to:
* trade supply and demand with more context
* combine structure, pressure, and confluence into one system
* avoid taking low-quality reactions from weak zones
* distinguish between bounce conditions and breakout conditions
It can be used for:
* intraday trading
* scalp execution
* swing context
* top-down confluence planning
---
## Key Interpretation Rules
A few simple rules improve results significantly:
* **Virgin zones are stronger than heavily tested zones**
* **Stacked zones are stronger than isolated zones**
* **High penetration weakens a zone**
* **A zone under siege should not be trusted blindly**
* **Trade confirmations work best when aligned with the dashboard**
* **Breaks matter less than acceptance beyond the zone**
* **Do not fight strong higher-timeframe confluence without clear failure evidence**
---
## Final Note
This indicator is designed to help traders make more objective decisions by reading where the market is likely to react, weaken, or break. It is not just a support/resistance tool, but a **multi-timeframe tactical decision framework** built around live zone strength, directional control, and structural confluence.
Instead of showing a single support or resistance level, this indicator builds a full **multi-timeframe supply/demand map**, scores the importance of each active zone, measures whether buyers or sellers are winning the battle inside those zones, and helps identify whether price is more likely to **bounce, continue, weaken, or break through**.
It is designed to answer three questions quickly:
1. **Who is in control right now?**
2. **Is the current floor/ceiling strong or failing?**
3. **Is there enough confluence to justify a trade?**
---
## Detailed Explanation of Features
### 1) Multi-Timeframe Supply & Demand Zones
The core of the indicator is the zone engine.
* **Blue Zones = Demand**
Areas where strong buying previously entered the market. Think of these as potential floors.
* **Orange Zones = Supply**
Areas where strong selling previously entered the market. Think of these as potential ceilings.
The indicator monitors multiple timeframes at once so you can see:
* local reaction zones
* lower timeframe scalp zones
* higher timeframe structural zones
This helps separate weak intraday levels from meaningful macro areas.
---
### 2) Zone Ranking System
Each active zone is ranked by relative strength.
* **#1 zones** are the strongest and most important active zones
* lower-ranked zones provide context and secondary reaction areas
* muted “ghost” zones help visualize broader structure without overpowering the chart
A high-rank zone matters more than a low-rank zone, especially when price is approaching it for the first time.
---
### 3) Zone Labels and Battle Bars
Each zone label shows:
**[Timeframe] | [Rank] | [Battle Bar]**
The battle bar is one of the most important parts of the system because it shows what is happening **inside the zone after creation**.
* **White blocks** = virgin zone
Price has not meaningfully interacted with it since creation. These are often the cleanest reaction zones.
* **Blue blocks** = buying pressure inside the zone
* **Orange blocks** = selling pressure inside the zone
This lets you read whether a zone is still healthy or under attack.
Examples:
* A **blue demand zone filling with orange blocks** means sellers are pressing into the floor
* An **orange supply zone filling with blue blocks** means buyers are leaning on the ceiling
* A heavily imbalanced battle bar often warns that a zone may fail soon
---
### 4) Dashboard / Tactical Console
The dashboard turns raw zone data into a real-time market read.
#### Overall Bias
A 0–100 weighted bias meter showing bullish vs bearish confluence from all active zones.
* **Higher values** favor bullish conditions
* **Lower values** favor bearish conditions
* It is proximity-weighted, so zones close to price matter more than zones far away
This is your broad “which side has the edge” read.
---
#### Logic Signal
This tells you the current condition of the market structure.
Common states include:
* **Stable**
Current structure is intact and there is no immediate warning
* **Zone Weakening**
Price is pushing deep into a zone and the level is losing integrity
* **Barrier Critical**
Price is near or beyond the critical break point of the current floor/ceiling
* **Vacuum Creep**
Price is drifting without fresh structural creation and may move inefficiently until it finds the next major zone
This is one of the best ways to know whether you should trust a level or expect failure.
---
#### Max Penetration
Shows how deeply price has pushed into a zone.
* low penetration usually means the level is reacting cleanly
* high penetration means the zone is being stress-tested
* extreme penetration often warns of likely breakdown or breakout
This is critical for avoiding “buying a floor that is already failing” or “shorting a ceiling that is already being absorbed.”
---
#### Price Driver
Identifies the immediate force affecting price.
Examples:
* **Driven by Demand**
* **Driven by Supply**
* **Scanning Market** when no clear driver is dominant
This is the short-term controller and helps with timing entries and understanding whether price is reacting to a live floor or ceiling.
---
#### Market Trend / Regime
This gives the broader condition of the tape.
Examples may include:
* bullish bias
* bearish bias
* bullish breakout
* sideways
* choppy
This helps distinguish between:
* clean directional conditions
* breakout conditions
* messy/noisy environments where selectivity matters more
---
#### Bars Since Demand / Structural Recency
Shows how long it has been since a new meaningful zone event occurred.
This helps identify whether the market is:
* still being supported by fresh structure
* or drifting away from recent zone formation
---
#### Scorecard
A fast summary of bullish vs bearish zone influence.
This is useful for quickly checking whether the market currently favors:
* demand-led structure
* supply-led structure
* or mixed conditions
---
#### Power Balance
A visual barometer of aggregated zone pressure.
This gives you a quick read on whether active market structure is dominated by buyers or sellers.
---
#### Latest Area
Displays the most relevant newly active zone around current price.
This is useful for understanding what the market is currently reacting to.
---
#### Zone Stack
Shows when multiple timeframes overlap in the same area.
This is extremely important.
A stack means:
* multiple zones from different timeframes are aligned in the same region
* the level usually carries more weight
* the reaction potential is often stronger than a single isolated zone
Stacked zones are some of the highest-quality areas on the chart.
---
### 5) Lower Dashboard / Per-Timeframe Readout
The lower left panel breaks down the individual timeframe state.
Depending on your version, it may include metrics such as:
* EMA alignment
* structural confirmation
* volume delta / VIDYA-based bias
* volume transition
* volume strength
This is where you can see whether lower timeframes and higher timeframes are aligned or diverging.
When several rows point in the same direction, trade quality improves.
---
### 6) Entry / Rejection Markers
The system can also display trade triggers or reaction markers when price interacts with zones.
Typical use:
* bullish confirmation when demand holds
* bearish confirmation when supply rejects
* optional management / exit-style prompts depending on your settings
These markers are not meant to replace context. They work best when aligned with the dashboard and zone structure.
---
## How to Trade the Indicator
The indicator is built around three core trade ideas.
---
### Play A: High-Confluence Reversal
This is the classic reversal off a strong floor or ceiling.
#### Long example
* price drops into a **stacked demand area**
* dashboard bias improves
* price driver shifts toward demand
* battle bar shows the zone is not being overwhelmed
* bullish confirmation appears
Entry:
* on the rejection candle close or confirmation marker
Stop:
* below the structural low of the stacked demand area
Target:
* nearest opposing supply
* then higher timeframe supply if momentum continues
#### Short example
Same logic in reverse at stacked supply.
Best use:
* when a major floor/ceiling is being defended
* when there is visible multi-timeframe confluence
---
### Play B: Trend Continuation Pullback
This is the bread-and-butter continuation trade.
#### Bullish continuation
* overall bias is bullish
* demand is dominant on the scorecard / power balance
* price pulls back into a fresh or lightly tested blue zone
* rejection confirms the level
Entry:
* on the bounce / confirmation candle close
Stop:
* below the supporting demand zone
Target:
* retest of recent highs
* then the next supply zone above
#### Bearish continuation
Reverse the process:
* bearish bias
* supply in control
* price pulls back into orange
* rejection confirms
This play works best when trading **with** the dominant structure instead of fading it.
---
### Play C: Zone Failure / Breakout
This is the “do not fade the level” setup.
Use this when:
* logic shifts to **Barrier Critical**
* max penetration is high
* battle bars show the defending side is losing
* price closes through the level with acceptance
#### Bullish breakout
* supply is absorbed
* price accepts above the ceiling
* old supply can become support on retest
#### Bearish breakdown
* demand is overrun
* price closes below the floor
* old demand can become resistance on retest
The key is not just the break itself, but whether price **accepts** beyond the zone.
---
## Practical Trading Workflow
A simple process for reading the indicator:
### Step 1: Identify the Controller
Check:
* Overall Bias
* Price Driver
* Power Balance
* Market Trend
This tells you whether the market is currently demand-led, supply-led, or mixed.
---
### Step 2: Evaluate the Zone
Before taking any entry, ask:
* is the zone virgin or already heavily tested?
* is it high-rank or low-rank?
* is it stacked with other timeframes?
* is it being defended or attacked?
Not all zones are equal.
---
### Step 3: Check Penetration
A clean reaction is very different from a zone that is already nearly broken.
* shallow penetration = healthier reaction
* deep penetration = caution
* extreme penetration = prepare for failure / breakout conditions
---
### Step 4: Wait for Confirmation
The highest-probability setups happen when:
* the dashboard agrees
* the zone quality is strong
* the controller is aligned
* a rejection / continuation trigger appears
This keeps you from trading every touch blindly.
---
### Step 5: Manage the Trade by Structure
For longs:
* stay valid while price holds above demand
* reduce if price loses the zone cleanly
For shorts:
* stay valid while price remains capped below supply
* reduce if price reclaims the zone with acceptance
Targets are usually:
* first opposing zone
* then the next higher-timeframe zone if momentum continues
---
## Best Use Cases
This indicator is best suited for traders who want to:
* trade supply and demand with more context
* combine structure, pressure, and confluence into one system
* avoid taking low-quality reactions from weak zones
* distinguish between bounce conditions and breakout conditions
It can be used for:
* intraday trading
* scalp execution
* swing context
* top-down confluence planning
---
## Key Interpretation Rules
A few simple rules improve results significantly:
* **Virgin zones are stronger than heavily tested zones**
* **Stacked zones are stronger than isolated zones**
* **High penetration weakens a zone**
* **A zone under siege should not be trusted blindly**
* **Trade confirmations work best when aligned with the dashboard**
* **Breaks matter less than acceptance beyond the zone**
* **Do not fight strong higher-timeframe confluence without clear failure evidence**
---
## Final Note
This indicator is designed to help traders make more objective decisions by reading where the market is likely to react, weaken, or break. It is not just a support/resistance tool, but a **multi-timeframe tactical decision framework** built around live zone strength, directional control, and structural confluence.
نص برمجي مفتوح المصدر
بروح TradingView الحقيقية، قام مبتكر هذا النص البرمجي بجعله مفتوح المصدر، بحيث يمكن للمتداولين مراجعة وظائفه والتحقق منها. شكرا للمؤلف! بينما يمكنك استخدامه مجانًا، تذكر أن إعادة نشر الكود يخضع لقواعد الموقع الخاصة بنا.

إخلاء المسؤولية
لا يُقصد بالمعلومات والمنشورات أن تكون، أو تشكل، أي نصيحة مالية أو استثمارية أو تجارية أو أنواع أخرى من النصائح أو التوصيات المقدمة أو المعتمدة من TradingView. اقرأ المزيد في شروط الاستخدام.
نص برمجي مفتوح المصدر
بروح TradingView الحقيقية، قام مبتكر هذا النص البرمجي بجعله مفتوح المصدر، بحيث يمكن للمتداولين مراجعة وظائفه والتحقق منها. شكرا للمؤلف! بينما يمكنك استخدامه مجانًا، تذكر أن إعادة نشر الكود يخضع لقواعد الموقع الخاصة بنا.
إخلاء المسؤولية
لا يُقصد بالمعلومات والمنشورات أن تكون، أو تشكل، أي نصيحة مالية أو استثمارية أو تجارية أو أنواع أخرى من النصائح أو التوصيات المقدمة أو المعتمدة من TradingView. اقرأ المزيد في شروط الاستخدام.