OPEN-SOURCE SCRIPT
WizTrader Imbalance Map (FVG)
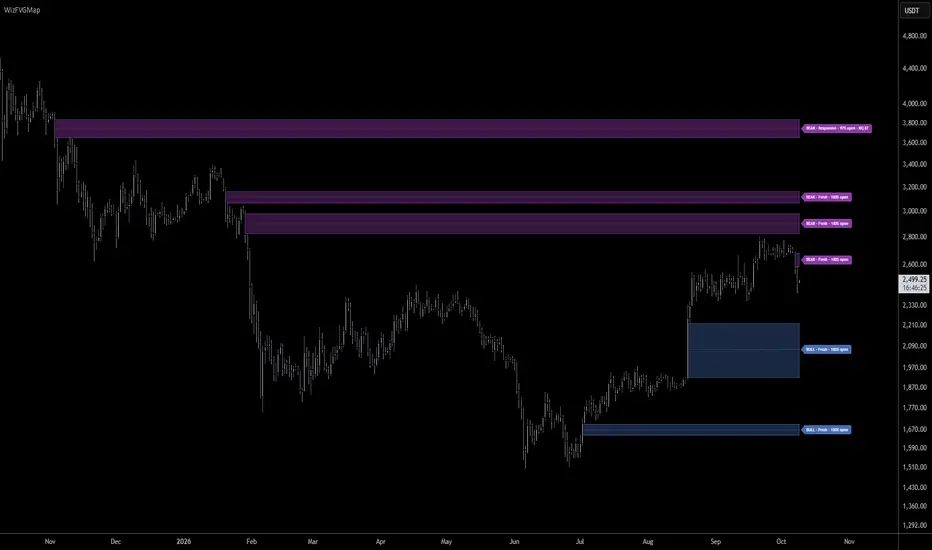
WizTrader Imbalance Map (FVG) is an open-source current-timeframe Fair Value Gap indicator designed to keep the chart focused on a small set of meaningful open FVGs instead of displaying every detected gap.
It identifies confirmed three-bar Fair Value Gaps, tracks their remaining unfilled area, evaluates how price reacts when they are retested, and ranks active zones using proximity, formation quality, reaction history, remaining area, and recency.
This version specifically covers classic three-bar FVGs on the chart timeframe. It does not model session-opening gaps, volume imbalances, or higher-timeframe FVGs.
Three-bar FVG model
A bullish FVG is confirmed when the low of the current confirmed bar is above the high from two bars earlier.
A bearish FVG is confirmed when the high of the current confirmed bar is below the low from two bars earlier.
The zone begins on the middle displacement bar and represents the price area between the first and third bars.
Formation Quality
Not every raw three-bar gap enters the map.
Each candidate must pass the selected profile's minimum FVG-height and displacement requirements.
Formation Quality is normalized from 0 to 1 and combines:
Using one fixed gap-strength scale means the same physical FVG receives the same gap-quality score regardless of the selected profile.
Partial fill tracking
The displayed box represents only the remaining unfilled portion of an FVG.
For bullish FVGs, the upper part of the zone is removed as price reaches downward through the gap.
For bearish FVGs, the lower part is removed as price reaches upward through the gap.
A move beyond the far edge, including a session gap completely across the zone, fully fills the FVG and removes it.
Reaction Quality
Formation Quality describes how an FVG was created. Reaction Quality evaluates what happens when price later returns.
After a retest ends, the script observes the subsequent response over a bounded window.
Reaction Quality combines:
With no favorable movement, no speed credit is awarded.
The favorable-move target and observation window scale with the selected profile:
If another retest begins before the observation window expires, the previous reaction is finalized before the new interaction starts.
Lifecycle
Each FVG can move through four active states:
Filled is the terminal event. A fully filled FVG is removed.
A Weakening zone can become Responsive again if later reaction evidence improves and enough of the zone remains.
Current zone ranking
The script maintains a bounded pool of open FVGs and ranks them using:
By default, two bullish and two bearish FVGs are shown. The user can select between one and five zones per side.
Ranking behavior also changes with the selected profile. Responsive favors nearby and recent FVGs more strongly, while Major gives more influence to Formation Quality and allows stronger zones to remain relevant at greater distances.
Display relevance
Each profile has a maximum display distance:
Thin zones remain protected within 2 ATR of current price so an FVG that is actively being tested does not disappear merely because only a small portion remains.
Beyond 2 ATR, the remaining zone height must still satisfy the selected profile's minimum FVG-size requirement relative to current ATR. This helps remove old line-like zones that are no longer visually significant.
Hidden zones are not automatically deleted from the internal pool and may become visible again if price approaches them.
Profiles
The profiles use the same underlying model but differ in admission thresholds, display range, reaction horizon, and ranking preferences.
50% Level
The optional 50% Level displays the midpoint of the original FVG until price reaches it for the first time.
Detailed labels
Detailed labels show:
Display controls
Users can control:
Display settings do not change the underlying FVG calculations.
Alerts
Available alert conditions:
Relevant-zone alerts follow the same current-map eligibility used for displayed zones.
Model design
The FVG definition itself uses the standard confirmed three-bar gap structure.
The differentiation is in how open FVGs are managed after detection:
The goal is not to introduce a new definition of Fair Value Gap. The goal is to provide a compact map of selected open FVGs whose condition and ranking can change as price interacts with them.
Limitations
This version evaluates classic three-bar FVGs on the current chart timeframe only.
It is a current-state map, not a historical snapshot renderer. Filled or internally pruned zones disappear from earlier chart areas.
Reaction Quality is a normalized model score, not a probability, expected return, or prediction.
FVGs and their historical reactions do not guarantee future support, resistance, continuation, reversal, or profitable trades.
It identifies confirmed three-bar Fair Value Gaps, tracks their remaining unfilled area, evaluates how price reacts when they are retested, and ranks active zones using proximity, formation quality, reaction history, remaining area, and recency.
This version specifically covers classic three-bar FVGs on the chart timeframe. It does not model session-opening gaps, volume imbalances, or higher-timeframe FVGs.
Three-bar FVG model
A bullish FVG is confirmed when the low of the current confirmed bar is above the high from two bars earlier.
A bearish FVG is confirmed when the high of the current confirmed bar is below the low from two bars earlier.
The zone begins on the middle displacement bar and represents the price area between the first and third bars.
Formation Quality
Not every raw three-bar gap enters the map.
Each candidate must pass the selected profile's minimum FVG-height and displacement requirements.
Formation Quality is normalized from 0 to 1 and combines:
- 40% FVG height strength - gap height is measured on one fixed scale across all profiles; 0.60 ATR or more receives full gap-strength credit
- 30% displacement body strength - middle-candle body size relative to ATR
- 30% displacement efficiency - the proportion of the displacement candle occupied by its body
Using one fixed gap-strength scale means the same physical FVG receives the same gap-quality score regardless of the selected profile.
Partial fill tracking
The displayed box represents only the remaining unfilled portion of an FVG.
For bullish FVGs, the upper part of the zone is removed as price reaches downward through the gap.
For bearish FVGs, the lower part is removed as price reaches upward through the gap.
A move beyond the far edge, including a session gap completely across the zone, fully fills the FVG and removes it.
Reaction Quality
Formation Quality describes how an FVG was created. Reaction Quality evaluates what happens when price later returns.
After a retest ends, the script observes the subsequent response over a bounded window.
Reaction Quality combines:
- 55% response distance - favorable movement away from the remaining FVG
- 20% response speed - faster favorable reactions receive more credit, scaled by the amount of movement actually achieved
- 25% retained area - zones that survive a retest with more unfilled area receive more credit
With no favorable movement, no speed credit is awarded.
The favorable-move target and observation window scale with the selected profile:
- Responsive - 1.0 ATR over 4 bars
- Balanced - 1.5 ATR over 6 bars
- Major - 2.5 ATR over 10 bars
If another retest begins before the observation window expires, the previous reaction is finalized before the new interaction starts.
Lifecycle
Each FVG can move through four active states:
- Fresh - no retest has occurred
- Tested - the zone has been retested but does not yet qualify as Responsive
- Responsive - completed reaction history shows a sufficiently strong response while meaningful zone area remains
- Weakening - the zone has been heavily consumed, repeated reactions are weak, or its latest reaction has deteriorated materially
Filled is the terminal event. A fully filled FVG is removed.
A Weakening zone can become Responsive again if later reaction evidence improves and enough of the zone remains.
Current zone ranking
The script maintains a bounded pool of open FVGs and ranks them using:
- distance from current price
- Formation Quality
- completed Reaction Quality
- remaining unfilled area
- recency of the latest interaction
- lifecycle state
By default, two bullish and two bearish FVGs are shown. The user can select between one and five zones per side.
Ranking behavior also changes with the selected profile. Responsive favors nearby and recent FVGs more strongly, while Major gives more influence to Formation Quality and allows stronger zones to remain relevant at greater distances.
Display relevance
Each profile has a maximum display distance:
- Responsive - 6 ATR
- Balanced - 10 ATR
- Major - 14 ATR
Thin zones remain protected within 2 ATR of current price so an FVG that is actively being tested does not disappear merely because only a small portion remains.
Beyond 2 ATR, the remaining zone height must still satisfy the selected profile's minimum FVG-size requirement relative to current ATR. This helps remove old line-like zones that are no longer visually significant.
Hidden zones are not automatically deleted from the internal pool and may become visible again if price approaches them.
Profiles
- Responsive - designed for smaller and more local FVGs, with stronger emphasis on proximity and recency
- Balanced - the default middle ground
- Major - requires broader and stronger formations and gives Formation Quality more influence than proximity
The profiles use the same underlying model but differ in admission thresholds, display range, reaction horizon, and ranking preferences.
50% Level
The optional 50% Level displays the midpoint of the original FVG until price reaches it for the first time.
Detailed labels
Detailed labels show:
- Bullish or Bearish direction
- current lifecycle state
- percentage of the original FVG still open
- RQ - Reaction Quality from 0 to 100 after at least one completed response
Display controls
Users can control:
- Imbalance Zones
- Extend Zones Right
- Zone Borders
- Zone Transparency
- 50% Level
- Zone Labels
- Zones per Side
- Fresh Imbalances
Display settings do not change the underlying FVG calculations.
Alerts
Available alert conditions:
- New Bullish Imbalance
- New Bearish Imbalance
- Any New Imbalance
- Imbalance Touch
- Imbalance 50% Reached
- Imbalance Filled
- Imbalance Responsive
- Imbalance Weakening
Relevant-zone alerts follow the same current-map eligibility used for displayed zones.
Model design
The FVG definition itself uses the standard confirmed three-bar gap structure.
The differentiation is in how open FVGs are managed after detection:
- formation-quality filtering
- progressive remaining-area tracking
- post-retest Reaction Quality
- Fresh / Tested / Responsive / Weakening lifecycle
- profile-specific ranking
- distance-aware display management
- small top-N visualization instead of plotting every qualifying FVG
The goal is not to introduce a new definition of Fair Value Gap. The goal is to provide a compact map of selected open FVGs whose condition and ranking can change as price interacts with them.
Limitations
This version evaluates classic three-bar FVGs on the current chart timeframe only.
It is a current-state map, not a historical snapshot renderer. Filled or internally pruned zones disappear from earlier chart areas.
Reaction Quality is a normalized model score, not a probability, expected return, or prediction.
FVGs and their historical reactions do not guarantee future support, resistance, continuation, reversal, or profitable trades.
نص برمجي مفتوح المصدر
بروح TradingView الحقيقية، قام مبتكر هذا النص البرمجي بجعله مفتوح المصدر، بحيث يمكن للمتداولين مراجعة وظائفه والتحقق منها. شكرا للمؤلف! بينما يمكنك استخدامه مجانًا، تذكر أن إعادة نشر الكود يخضع لقواعد الموقع الخاصة بنا.

WizTrader — proprietary Pine Script tools for market structure and trend analysis.
wiztrader.io
Website: wiztrader.io
WizTrader Pro & WizMomentum Pro (Invite-Only)
wiztrader.io
Website: wiztrader.io
WizTrader Pro & WizMomentum Pro (Invite-Only)
إخلاء المسؤولية
لا يُقصد بالمعلومات والمنشورات أن تكون، أو تشكل، أي نصيحة مالية أو استثمارية أو تجارية أو أنواع أخرى من النصائح أو التوصيات المقدمة أو المعتمدة من TradingView. اقرأ المزيد في شروط الاستخدام.
نص برمجي مفتوح المصدر
بروح TradingView الحقيقية، قام مبتكر هذا النص البرمجي بجعله مفتوح المصدر، بحيث يمكن للمتداولين مراجعة وظائفه والتحقق منها. شكرا للمؤلف! بينما يمكنك استخدامه مجانًا، تذكر أن إعادة نشر الكود يخضع لقواعد الموقع الخاصة بنا.
WizTrader — proprietary Pine Script tools for market structure and trend analysis.
wiztrader.io
Website: wiztrader.io
WizTrader Pro & WizMomentum Pro (Invite-Only)
wiztrader.io
Website: wiztrader.io
WizTrader Pro & WizMomentum Pro (Invite-Only)
إخلاء المسؤولية
لا يُقصد بالمعلومات والمنشورات أن تكون، أو تشكل، أي نصيحة مالية أو استثمارية أو تجارية أو أنواع أخرى من النصائح أو التوصيات المقدمة أو المعتمدة من TradingView. اقرأ المزيد في شروط الاستخدام.