تم تحديثه
CHT 3 Consecutive Candles
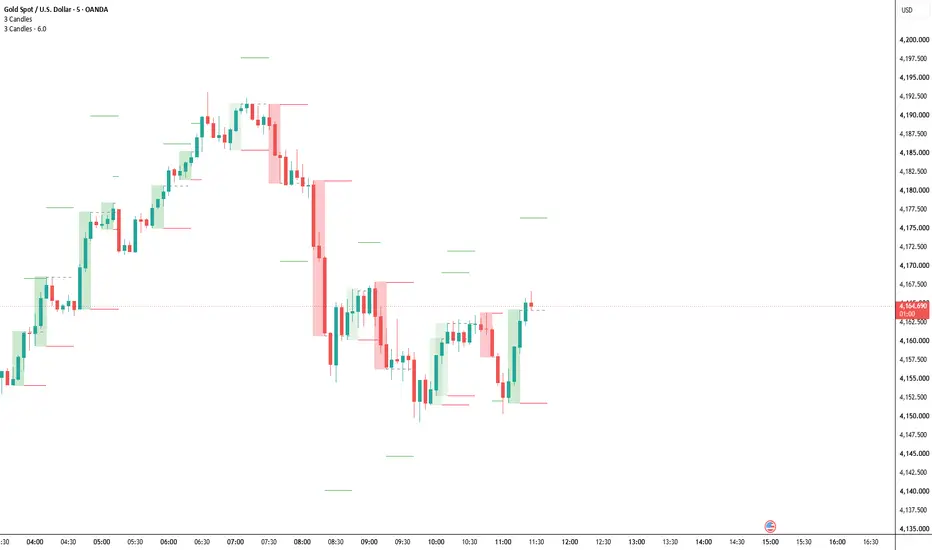
This indicator spots when a set number of bullish or bearish candles form in a row, and marks it directly on your chart with a coloured box and a label.
How it works
A candle counts as bullish if it closes above its open, and bearish if it closes below its open. When the chosen number of same-direction candles appear back to back (3 by default), the indicator draws a box around the whole run. Green means a bullish run and red means a bearish run. A label at the edge of the box shows the candle count and direction (3▲ or 3▼). A doji, where the open and close are equal, counts as neither and breaks the run.
How it works
A candle counts as bullish if it closes above its open, and bearish if it closes below its open. When the chosen number of same-direction candles appear back to back (3 by default), the indicator draws a box around the whole run. Green means a bullish run and red means a bearish run. A label at the edge of the box shows the candle count and direction (3▲ or 3▼). A doji, where the open and close are equal, counts as neither and breaks the run.
ملاحظات الأخبار
now the sl is at the top bottom of the box when before it would just be at the high/low of the 1st candle stick ملاحظات الأخبار
now there is a toggle option to see higher probiblity setups 
إخلاء المسؤولية
لا يُقصد بالمعلومات والمنشورات أن تكون، أو تشكل، أي نصيحة مالية أو استثمارية أو تجارية أو أنواع أخرى من النصائح أو التوصيات المقدمة أو المعتمدة من TradingView. اقرأ المزيد في شروط الاستخدام.
إخلاء المسؤولية
لا يُقصد بالمعلومات والمنشورات أن تكون، أو تشكل، أي نصيحة مالية أو استثمارية أو تجارية أو أنواع أخرى من النصائح أو التوصيات المقدمة أو المعتمدة من TradingView. اقرأ المزيد في شروط الاستخدام.