OPEN-SOURCE SCRIPT
NexBitX Algo - RSI Pane v1.1
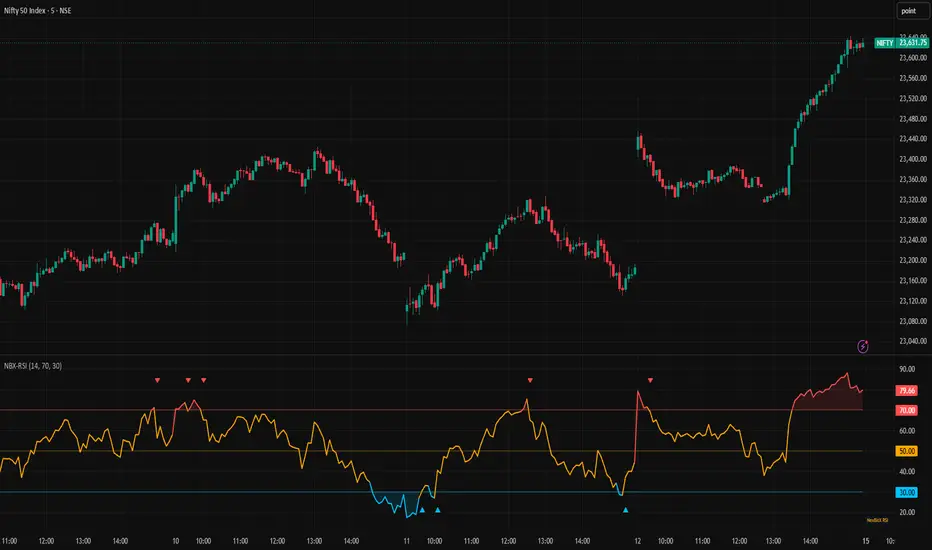
NexBitX Algo — RSI Pane v1.1
NexBitX Algo — RSI Pane is a clean momentum indicator designed to help traders identify overbought, oversold, and neutral RSI market conditions with professional NexBitX styling.
This indicator plots RSI in a separate pane with dynamic color changes, overbought/oversold levels, midline reference, zone fills, and RSI exit signals.
Key Features
✅ RSI Momentum Analysis
✅ Overbought & Oversold Zones
✅ Dynamic RSI Color Change
✅ RSI Buy Signal when exiting Oversold Zone
✅ RSI Sell Signal when exiting Overbought Zone
✅ Clean RSI Pane Layout
✅ NexBitX Branded Watermark
How It Works
• RSI above Overbought level indicates strong momentum but possible exhaustion.
• RSI below Oversold level indicates weak momentum but possible reversal.
• RSI crossing back above Oversold may suggest a potential buy setup.
• RSI crossing back below Overbought may suggest a potential sell setup.
Best Use
This indicator can be used for:
• Stocks
• Index
• Futures & Options
• Forex
• Commodities
• Crypto
It works best when combined with trend indicators, support/resistance, price action, and proper risk management.
Disclaimer
This indicator is intended for educational and analytical purposes only. It does not provide financial advice or guarantee trading results. Always perform your own analysis and use proper risk management when trading.
Developed by NexBitX Algo.
NexBitX Algo — RSI Pane is a clean momentum indicator designed to help traders identify overbought, oversold, and neutral RSI market conditions with professional NexBitX styling.
This indicator plots RSI in a separate pane with dynamic color changes, overbought/oversold levels, midline reference, zone fills, and RSI exit signals.
Key Features
✅ RSI Momentum Analysis
✅ Overbought & Oversold Zones
✅ Dynamic RSI Color Change
✅ RSI Buy Signal when exiting Oversold Zone
✅ RSI Sell Signal when exiting Overbought Zone
✅ Clean RSI Pane Layout
✅ NexBitX Branded Watermark
How It Works
• RSI above Overbought level indicates strong momentum but possible exhaustion.
• RSI below Oversold level indicates weak momentum but possible reversal.
• RSI crossing back above Oversold may suggest a potential buy setup.
• RSI crossing back below Overbought may suggest a potential sell setup.
Best Use
This indicator can be used for:
• Stocks
• Index
• Futures & Options
• Forex
• Commodities
• Crypto
It works best when combined with trend indicators, support/resistance, price action, and proper risk management.
Disclaimer
This indicator is intended for educational and analytical purposes only. It does not provide financial advice or guarantee trading results. Always perform your own analysis and use proper risk management when trading.
Developed by NexBitX Algo.
نص برمجي مفتوح المصدر
بروح TradingView الحقيقية، قام مبتكر هذا النص البرمجي بجعله مفتوح المصدر، بحيث يمكن للمتداولين مراجعة وظائفه والتحقق منها. شكرا للمؤلف! بينما يمكنك استخدامه مجانًا، تذكر أن إعادة نشر الكود يخضع لقواعد الموقع الخاصة بنا.

إخلاء المسؤولية
لا يُقصد بالمعلومات والمنشورات أن تكون، أو تشكل، أي نصيحة مالية أو استثمارية أو تجارية أو أنواع أخرى من النصائح أو التوصيات المقدمة أو المعتمدة من TradingView. اقرأ المزيد في شروط الاستخدام.
نص برمجي مفتوح المصدر
بروح TradingView الحقيقية، قام مبتكر هذا النص البرمجي بجعله مفتوح المصدر، بحيث يمكن للمتداولين مراجعة وظائفه والتحقق منها. شكرا للمؤلف! بينما يمكنك استخدامه مجانًا، تذكر أن إعادة نشر الكود يخضع لقواعد الموقع الخاصة بنا.
إخلاء المسؤولية
لا يُقصد بالمعلومات والمنشورات أن تكون، أو تشكل، أي نصيحة مالية أو استثمارية أو تجارية أو أنواع أخرى من النصائح أو التوصيات المقدمة أو المعتمدة من TradingView. اقرأ المزيد في شروط الاستخدام.