PROTECTED SOURCE SCRIPT
MACD + RSI Alignment
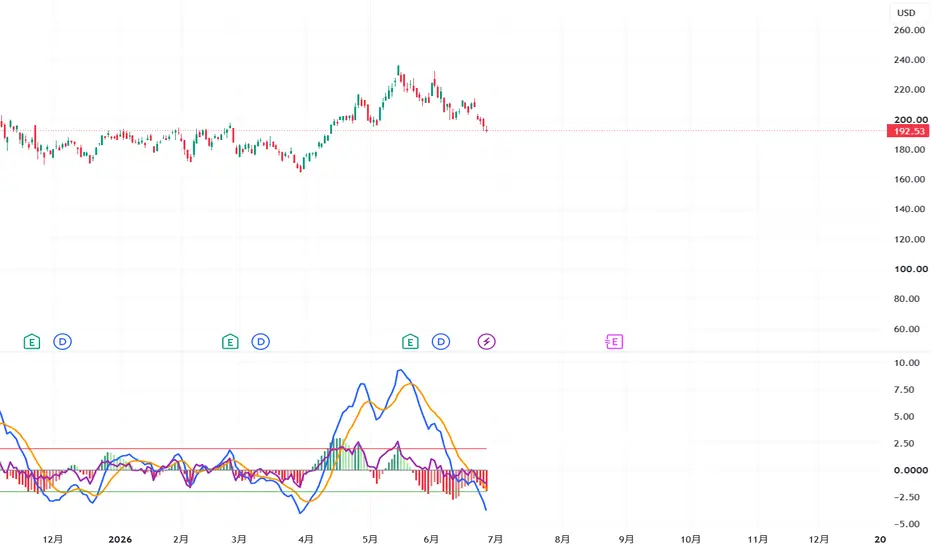
This indicator combines MACD and RSI into a single oscillator.
The MACD is dynamically normalized so that its zero line is aligned with the RSI 50 level, allowing both indicators to be analyzed within the same pane without switching between separate windows.
-Features-
Combines MACD and RSI into a single indicator.
Aligns the MACD Zero Line with the RSI 50 Level.
Dynamically scales the MACD to improve visual comparison with RSI.
Four-color MACD histogram.
Includes MACD Line, Signal Line, and RSI in one panel.
Displays reference levels corresponding to RSI 70 / 50 / 30.
-How It Works-
Unlike traditional layouts where MACD and RSI are displayed in separate panels with different scales, this script transforms the MACD into a normalized scale based on its recent maximum absolute value.
This allows:
MACD = 0 to coincide with RSI = 50
Positive MACD values to appear above the RSI midpoint
Negative MACD values to appear below the RSI midpoint
The result is a cleaner visualization that helps traders quickly identify trend direction, momentum, and RSI strength simultaneously.
-Typical Use Cases-
Confirm momentum with both MACD and RSI at the same time.
Identify trend continuation when both indicators move above their common center line.
Detect weakening momentum using the four-color histogram.
Use as a confirmation tool alongside indicators such as WaveTrend, Bollinger Bands, or moving averages.
Your feedback welcomed.
The MACD is dynamically normalized so that its zero line is aligned with the RSI 50 level, allowing both indicators to be analyzed within the same pane without switching between separate windows.
-Features-
Combines MACD and RSI into a single indicator.
Aligns the MACD Zero Line with the RSI 50 Level.
Dynamically scales the MACD to improve visual comparison with RSI.
Four-color MACD histogram.
Includes MACD Line, Signal Line, and RSI in one panel.
Displays reference levels corresponding to RSI 70 / 50 / 30.
-How It Works-
Unlike traditional layouts where MACD and RSI are displayed in separate panels with different scales, this script transforms the MACD into a normalized scale based on its recent maximum absolute value.
This allows:
MACD = 0 to coincide with RSI = 50
Positive MACD values to appear above the RSI midpoint
Negative MACD values to appear below the RSI midpoint
The result is a cleaner visualization that helps traders quickly identify trend direction, momentum, and RSI strength simultaneously.
-Typical Use Cases-
Confirm momentum with both MACD and RSI at the same time.
Identify trend continuation when both indicators move above their common center line.
Detect weakening momentum using the four-color histogram.
Use as a confirmation tool alongside indicators such as WaveTrend, Bollinger Bands, or moving averages.
Your feedback welcomed.
نص برمجي محمي
تم نشر هذا النص البرمجي كمصدر مغلق. ومع ذلك، يمكنك استخدامه بحرية ودون أي قيود - تعرف على المزيد هنا.

إخلاء المسؤولية
لا يُقصد بالمعلومات والمنشورات أن تكون، أو تشكل، أي نصيحة مالية أو استثمارية أو تجارية أو أنواع أخرى من النصائح أو التوصيات المقدمة أو المعتمدة من TradingView. اقرأ المزيد في شروط الاستخدام.
نص برمجي محمي
تم نشر هذا النص البرمجي كمصدر مغلق. ومع ذلك، يمكنك استخدامه بحرية ودون أي قيود - تعرف على المزيد هنا.
إخلاء المسؤولية
لا يُقصد بالمعلومات والمنشورات أن تكون، أو تشكل، أي نصيحة مالية أو استثمارية أو تجارية أو أنواع أخرى من النصائح أو التوصيات المقدمة أو المعتمدة من TradingView. اقرأ المزيد في شروط الاستخدام.