KP56 Multi-Symbol Candles
OVERVIEW
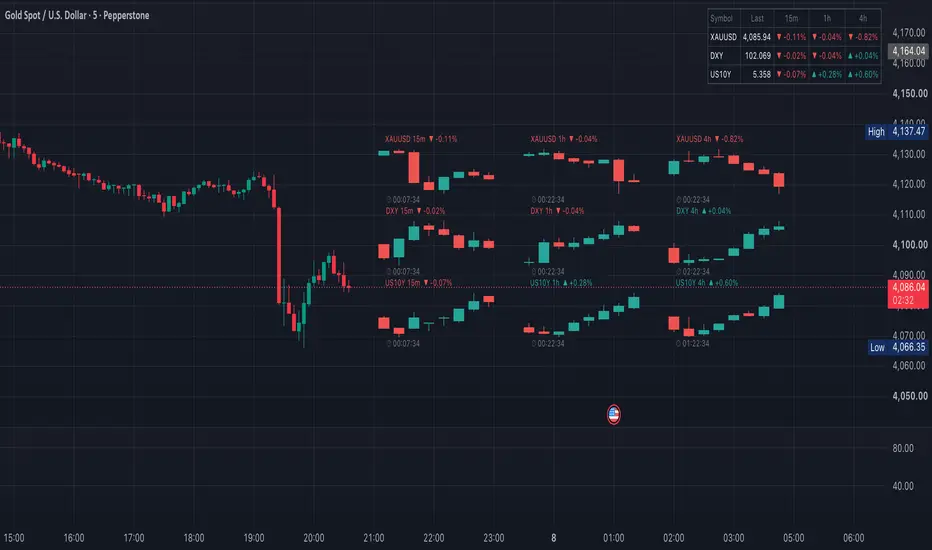
This indicator draws mini candle blocks for several symbols and several timeframes in the empty space to the right of the current price, so you can watch related markets without leaving your main chart. It was built for gold traders who want to keep an eye on instruments such as the US Dollar Index or US 10-year yield, but it works with any symbols.
WHAT IT SHOWS
- Up to 5 symbols: the chart's own symbol plus 4 user-selectable symbols, each with its own on/off switch.
- Up to 4 timeframes, each with its own on/off switch.
- Each symbol is one row, each timeframe is one block of candles in that row.
- A label above every block with the symbol, timeframe, and the percent change of the current candle (close vs. open).
- A countdown under every block showing the time left until the current candle of that symbol and timeframe closes.
- An optional summary table with the last price and the current-candle percent change per timeframe for every enabled symbol.
HOW IT WORKS
The script requests open, high, low, close, time and close time for every enabled symbol/timeframe pair with request.security() using lookahead off. Completed higher-timeframe candles are stored as they appear, and the forming candle is updated on every tick. On the last bar the stored candles are drawn with boxes and lines.
The rows are placed inside the price range currently visible on the chart, so the blocks stay on screen when you scroll or zoom. Each block is scaled to its own high-low range to fit its row.
HOW TO USE
1. Add the indicator to your chart and scroll left to leave free space to the right of the last bar.
2. In Inputs, choose the symbols and timeframes and tick the ones you want to see.
3. Adjust the number of candles per block, the distance from the last bar, colors, text size and table position.
4. Candle blocks, countdowns and the table can each be turned off separately.
LIMITATIONS
- Every block uses its own vertical scale. The blocks show candle shape and direction only; their position does not correspond to the chart's price axis and cannot be used to compare price levels between symbols.
- Timeframes lower than the chart timeframe are hidden.
- History is built from the chart's loaded bars, so a high timeframe on a very low chart timeframe may show fewer candles than requested.
- The script only recalculates when the chart symbol receives a tick. The countdown and the other symbols' candles do not update between ticks.
- If another symbol's market is closed, its last candle stays as is and the countdown shows it as closed.
- Data for other symbols depends on your data plan; some feeds may be delayed.
This script is a visual monitoring tool. It does not generate trading signals and is not financial advice.
This indicator draws mini candle blocks for several symbols and several timeframes in the empty space to the right of the current price, so you can watch related markets without leaving your main chart. It was built for gold traders who want to keep an eye on instruments such as the US Dollar Index or US 10-year yield, but it works with any symbols.
WHAT IT SHOWS
- Up to 5 symbols: the chart's own symbol plus 4 user-selectable symbols, each with its own on/off switch.
- Up to 4 timeframes, each with its own on/off switch.
- Each symbol is one row, each timeframe is one block of candles in that row.
- A label above every block with the symbol, timeframe, and the percent change of the current candle (close vs. open).
- A countdown under every block showing the time left until the current candle of that symbol and timeframe closes.
- An optional summary table with the last price and the current-candle percent change per timeframe for every enabled symbol.
HOW IT WORKS
The script requests open, high, low, close, time and close time for every enabled symbol/timeframe pair with request.security() using lookahead off. Completed higher-timeframe candles are stored as they appear, and the forming candle is updated on every tick. On the last bar the stored candles are drawn with boxes and lines.
The rows are placed inside the price range currently visible on the chart, so the blocks stay on screen when you scroll or zoom. Each block is scaled to its own high-low range to fit its row.
HOW TO USE
1. Add the indicator to your chart and scroll left to leave free space to the right of the last bar.
2. In Inputs, choose the symbols and timeframes and tick the ones you want to see.
3. Adjust the number of candles per block, the distance from the last bar, colors, text size and table position.
4. Candle blocks, countdowns and the table can each be turned off separately.
LIMITATIONS
- Every block uses its own vertical scale. The blocks show candle shape and direction only; their position does not correspond to the chart's price axis and cannot be used to compare price levels between symbols.
- Timeframes lower than the chart timeframe are hidden.
- History is built from the chart's loaded bars, so a high timeframe on a very low chart timeframe may show fewer candles than requested.
- The script only recalculates when the chart symbol receives a tick. The countdown and the other symbols' candles do not update between ticks.
- If another symbol's market is closed, its last candle stays as is and the countdown shows it as closed.
- Data for other symbols depends on your data plan; some feeds may be delayed.
This script is a visual monitoring tool. It does not generate trading signals and is not financial advice.

إخلاء المسؤولية
لا يُقصد بالمعلومات والمنشورات أن تكون، أو تشكل، أي نصيحة مالية أو استثمارية أو تجارية أو أنواع أخرى من النصائح أو التوصيات المقدمة أو المعتمدة من TradingView. اقرأ المزيد في شروط الاستخدام.
إخلاء المسؤولية
لا يُقصد بالمعلومات والمنشورات أن تكون، أو تشكل، أي نصيحة مالية أو استثمارية أو تجارية أو أنواع أخرى من النصائح أو التوصيات المقدمة أو المعتمدة من TradingView. اقرأ المزيد في شروط الاستخدام.